Self-hosted · Open Source · AGPL-3.0 License · Matter Support (Beta)
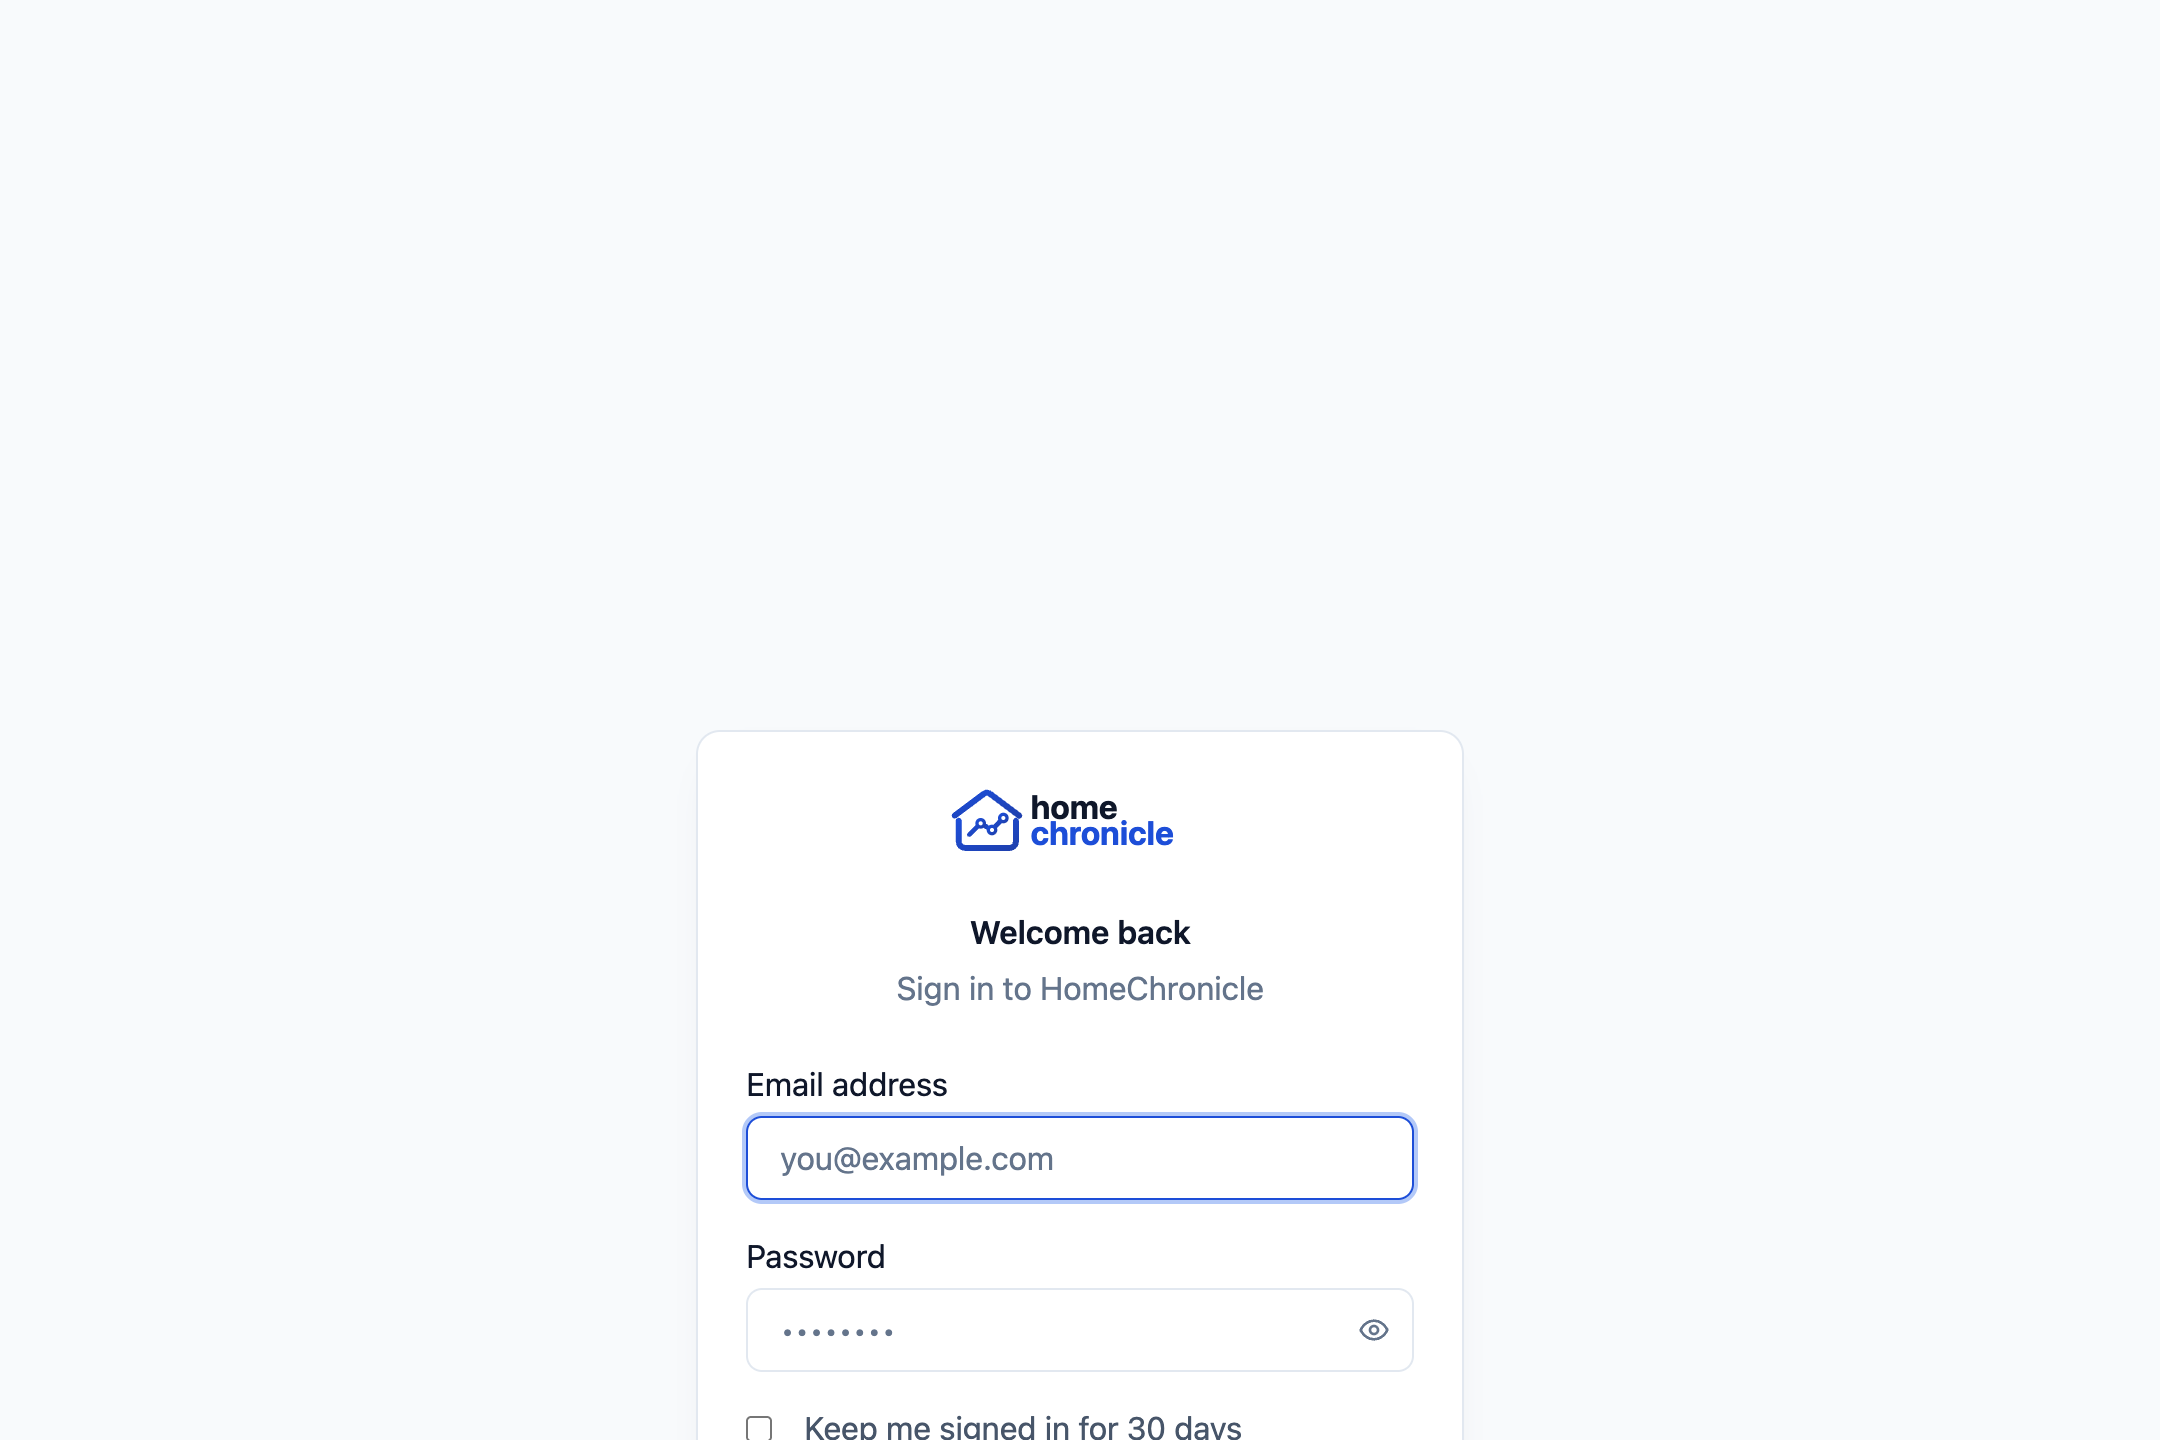
homechronicle

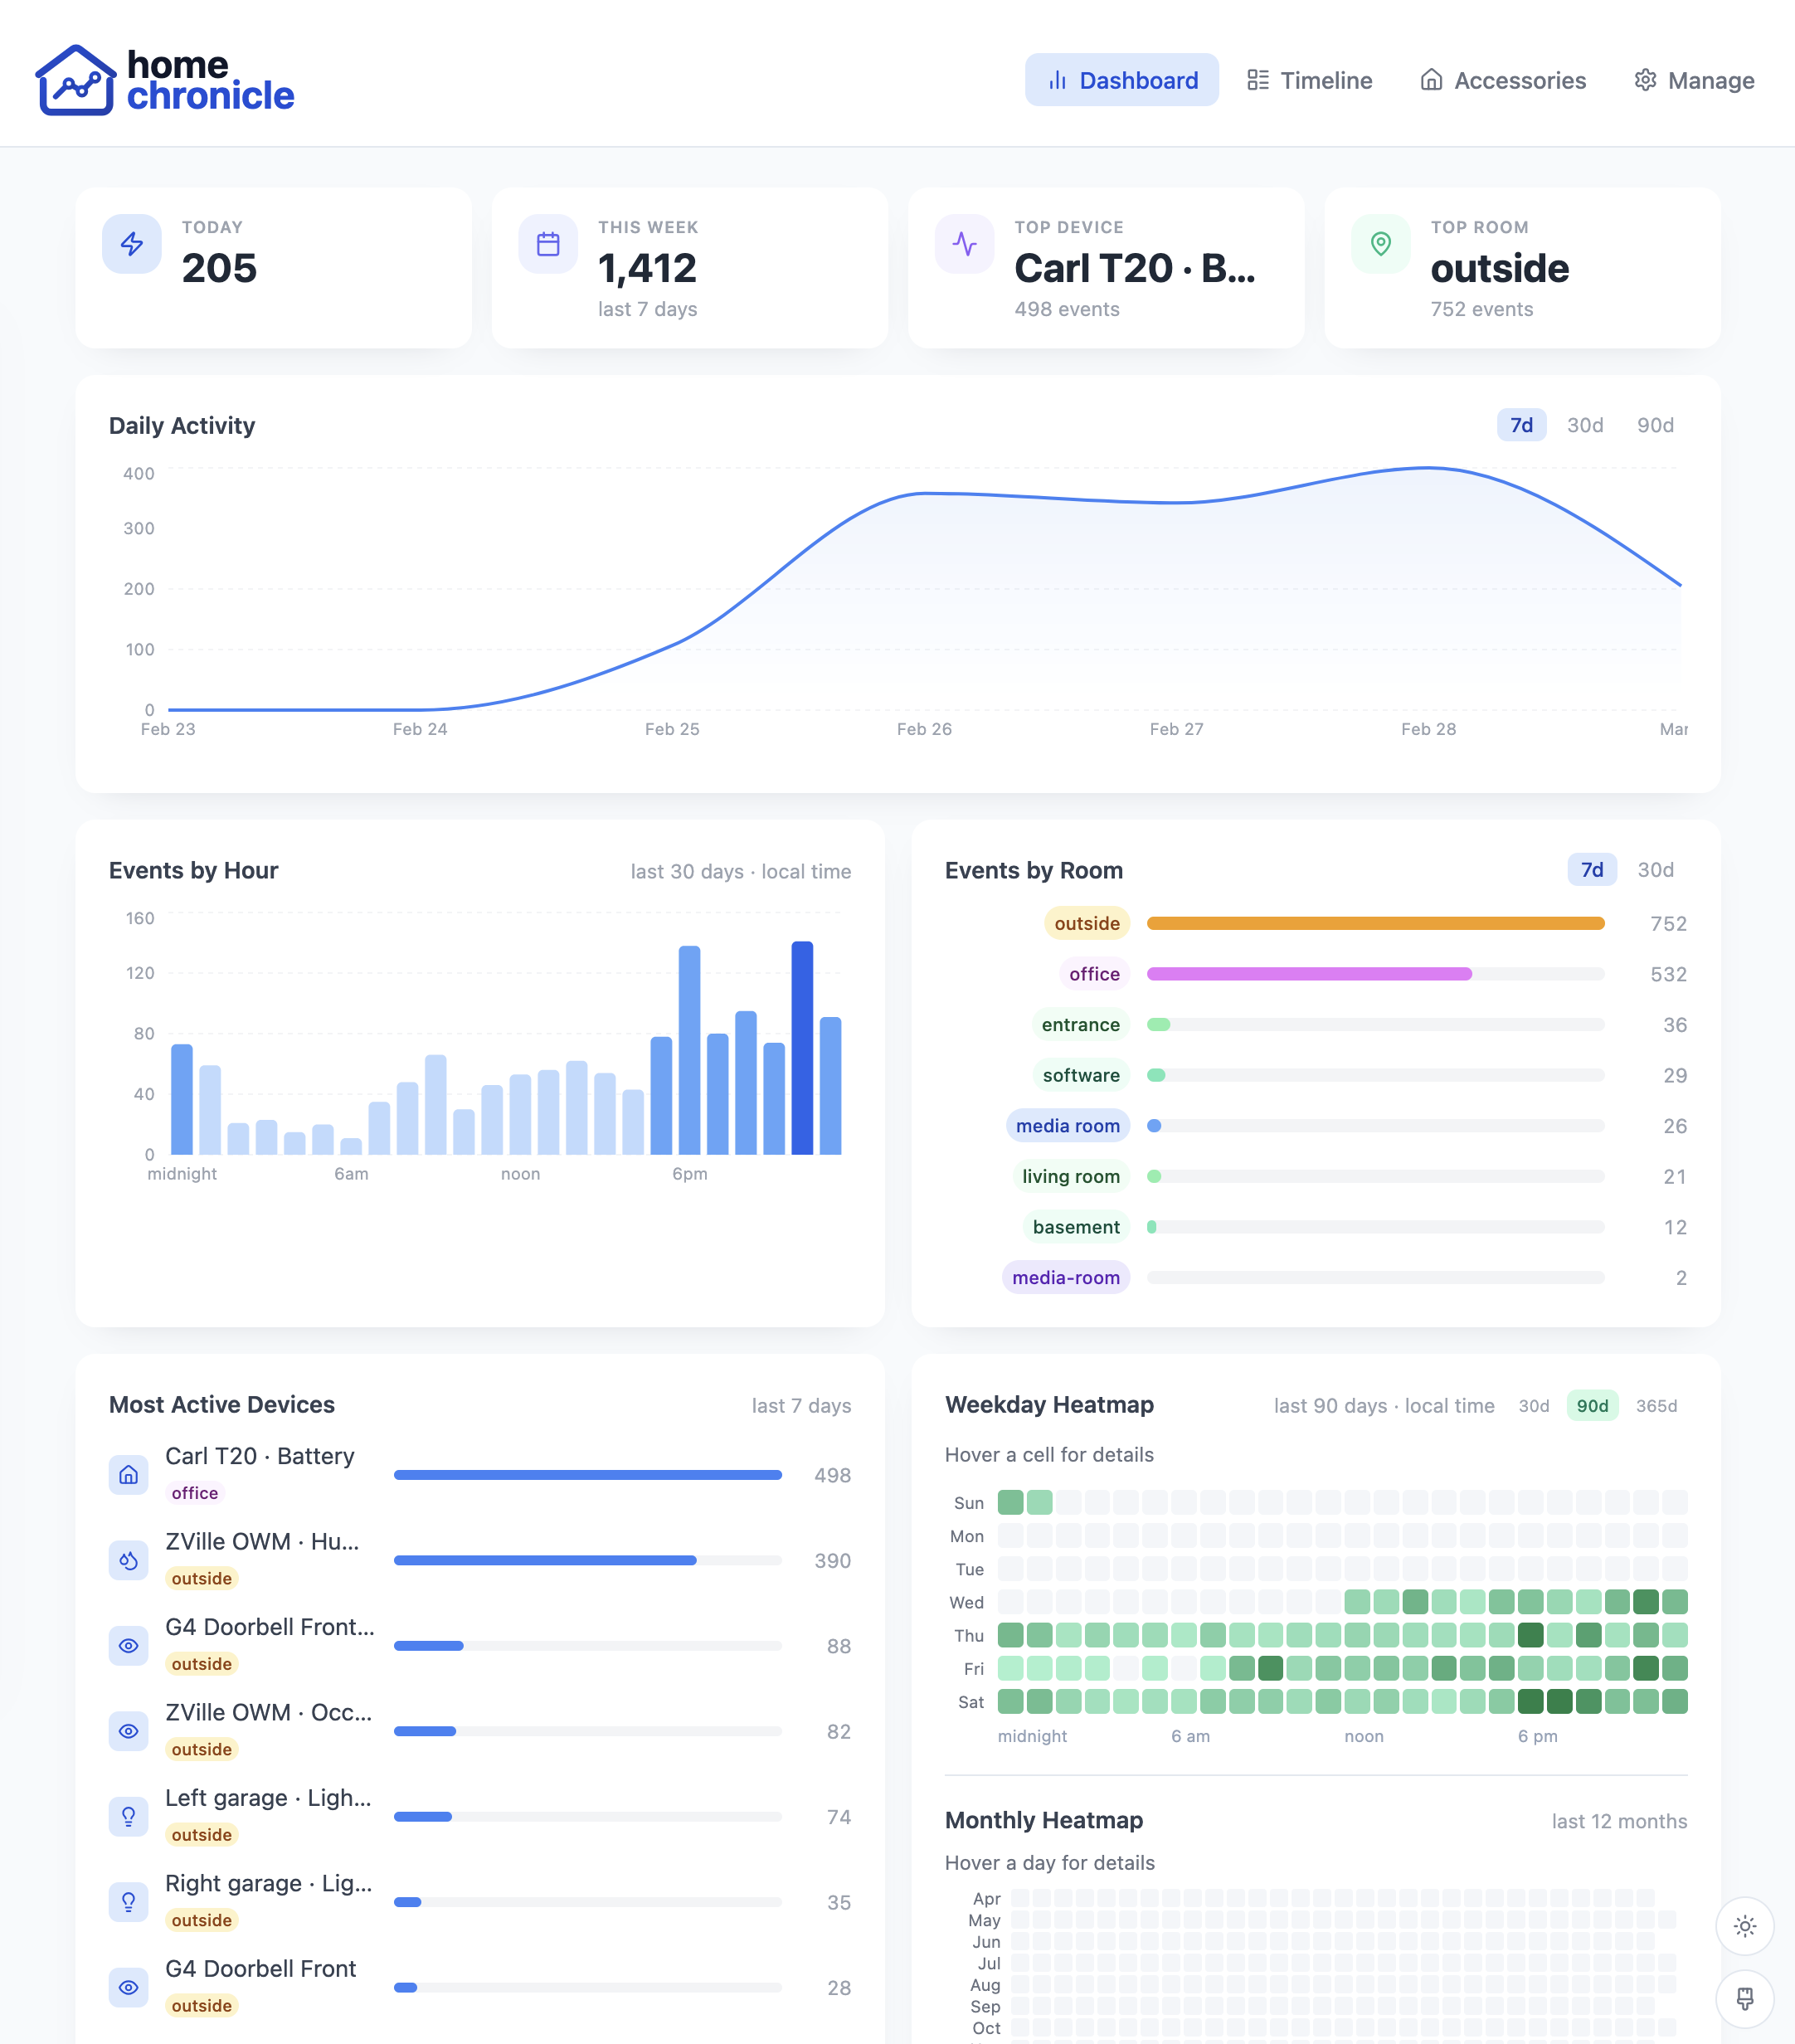
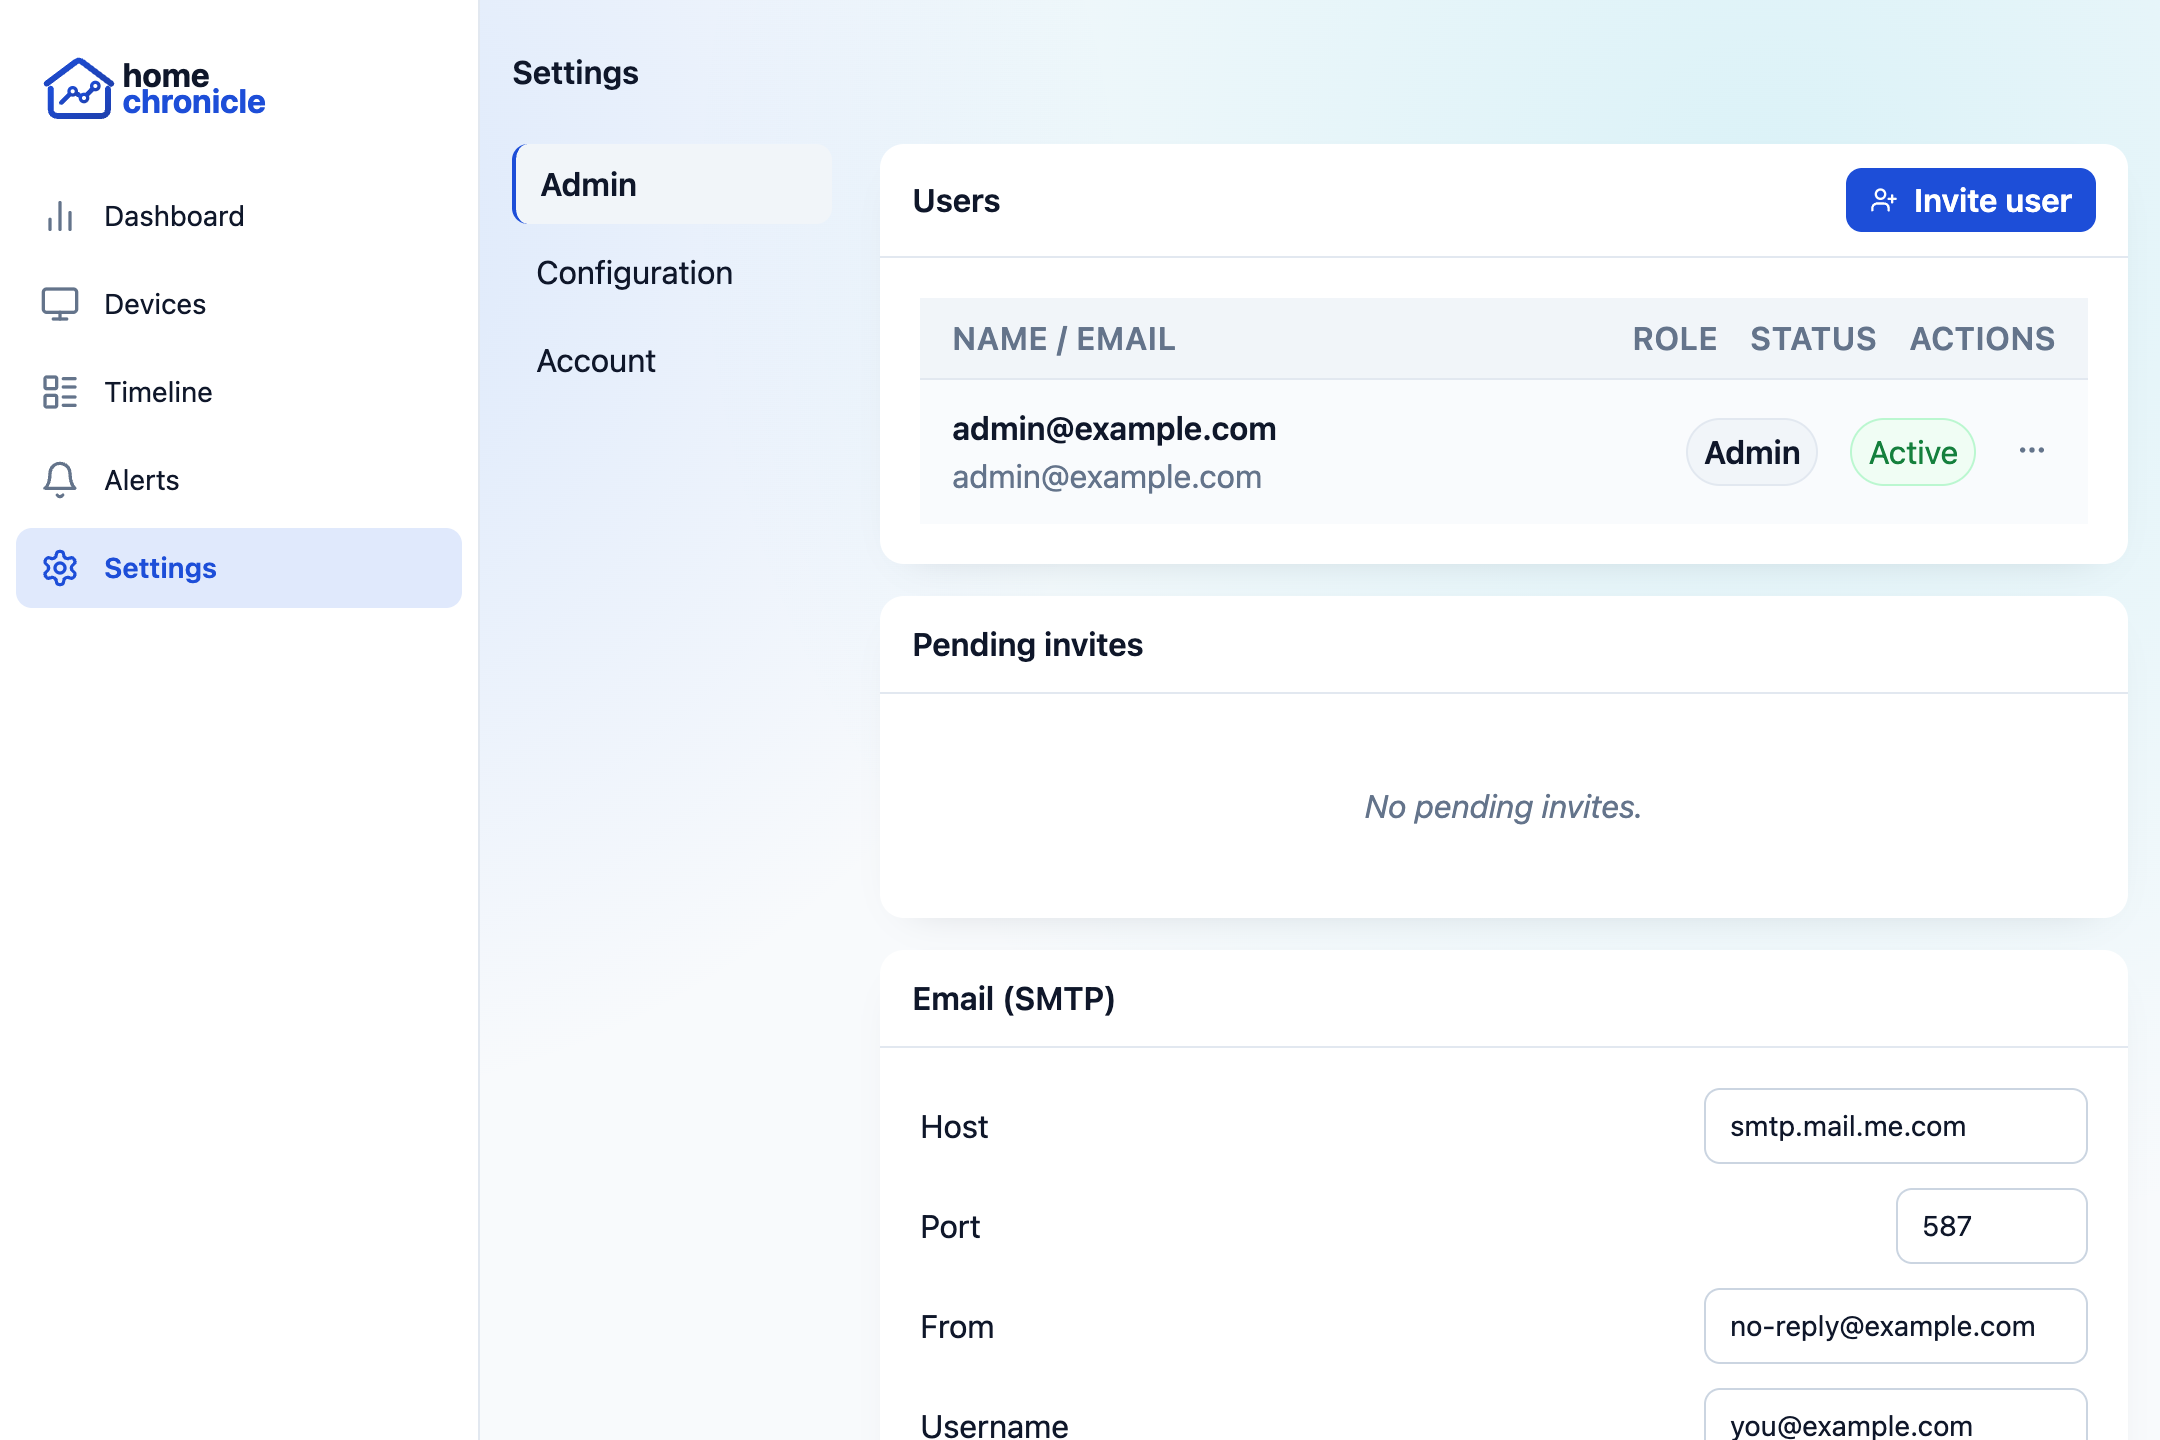
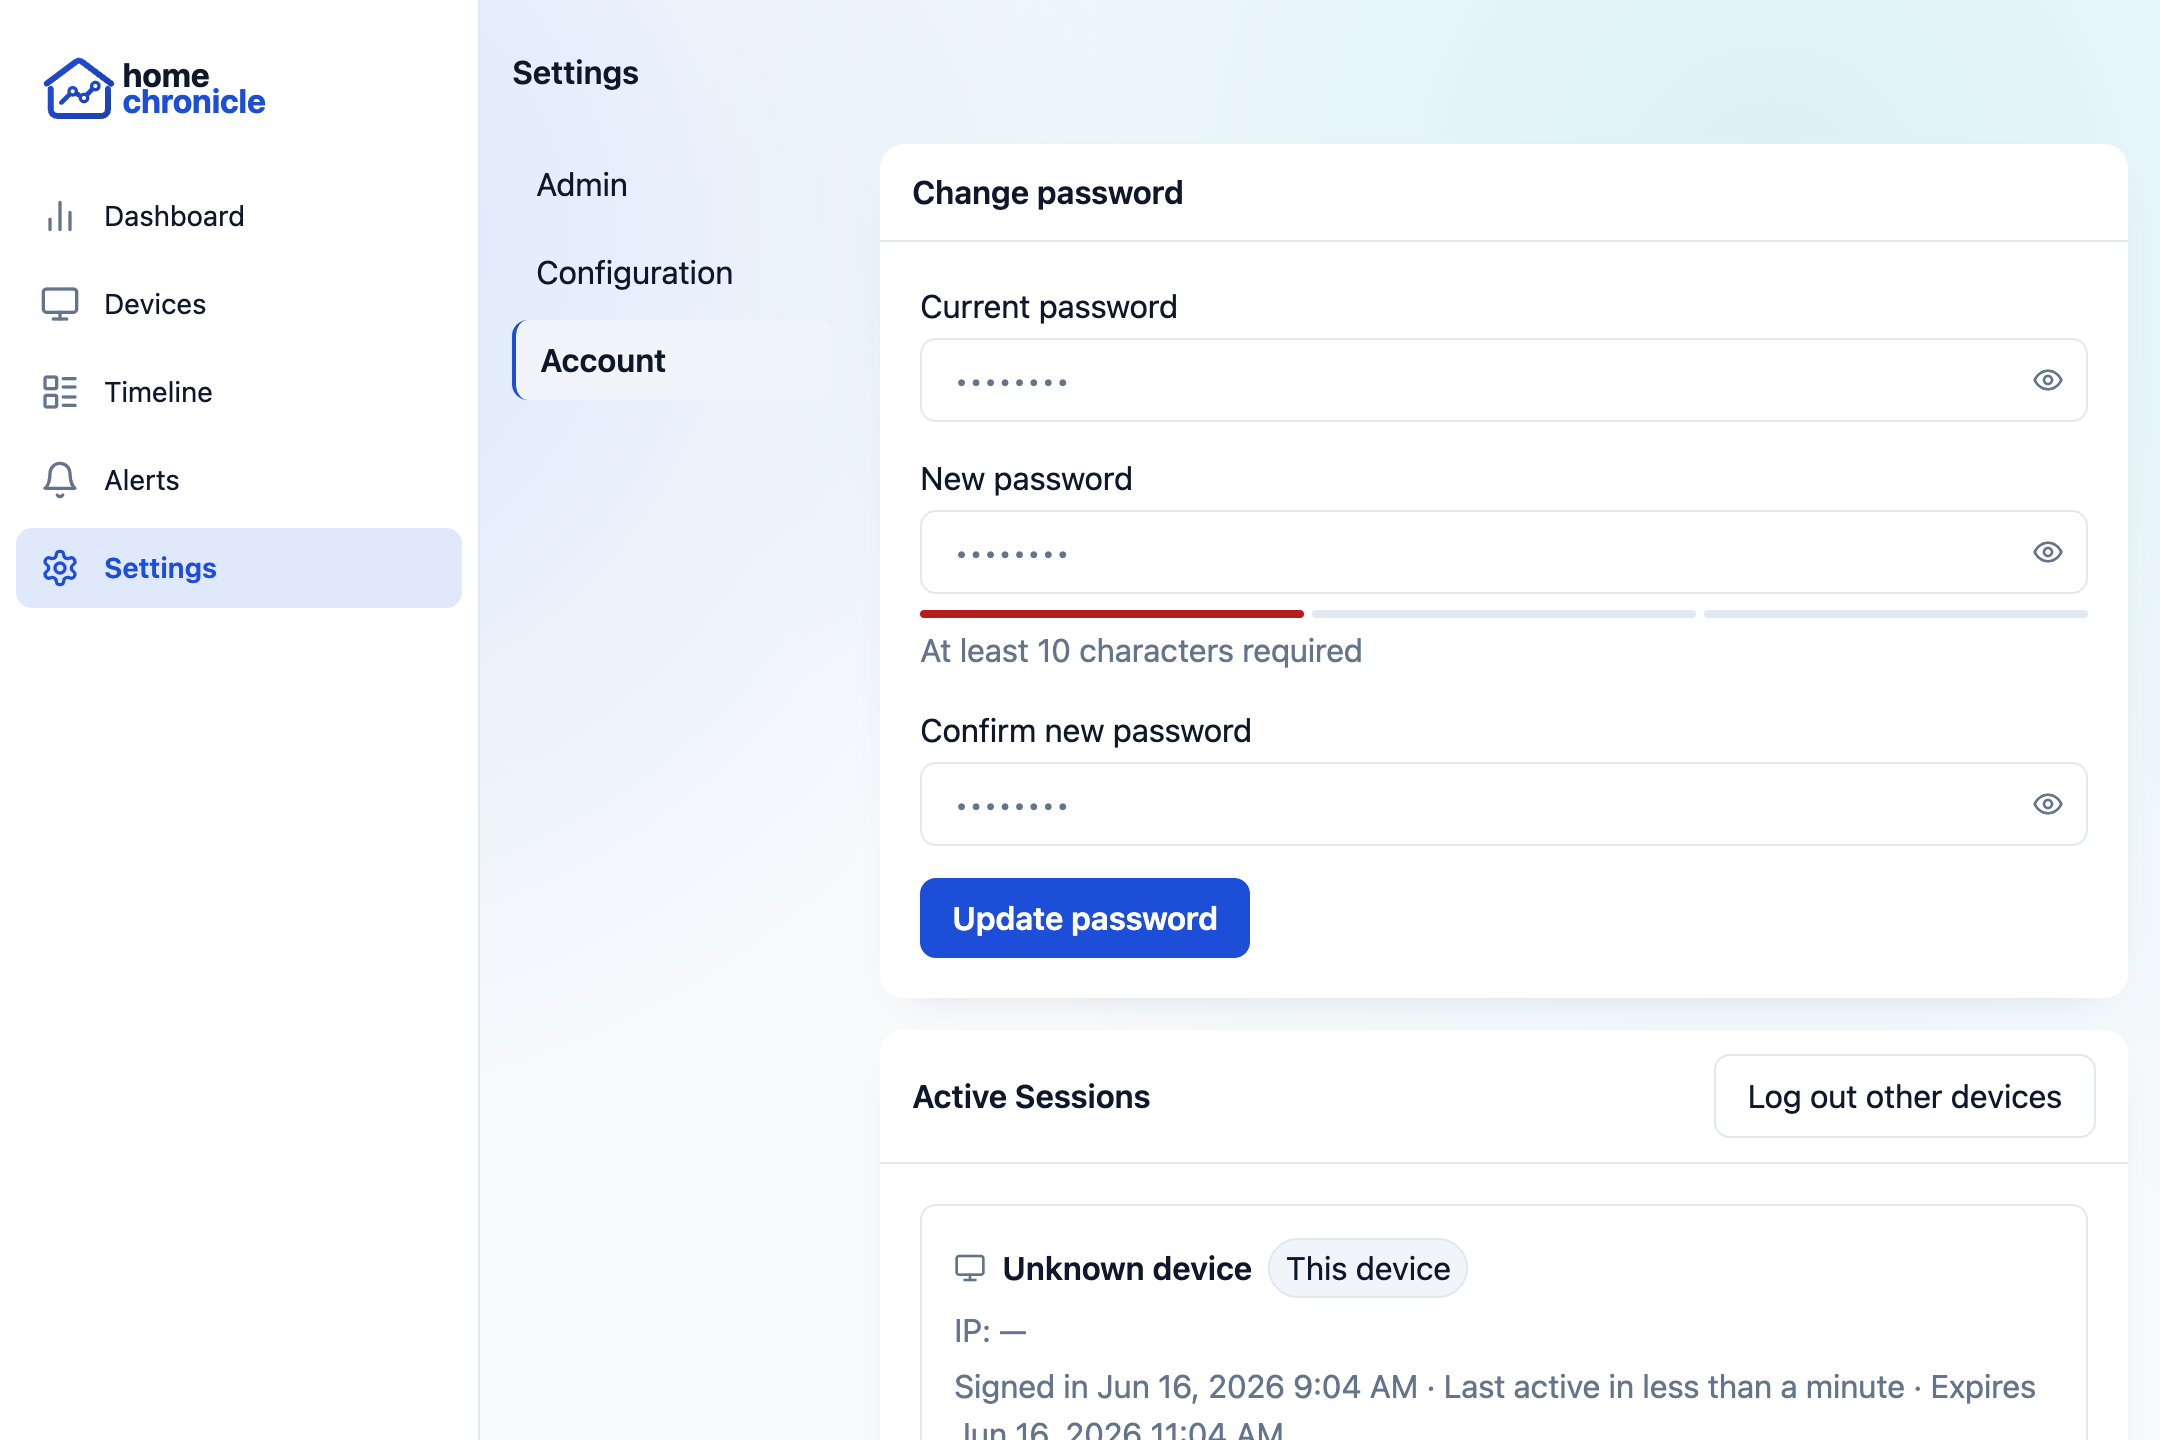
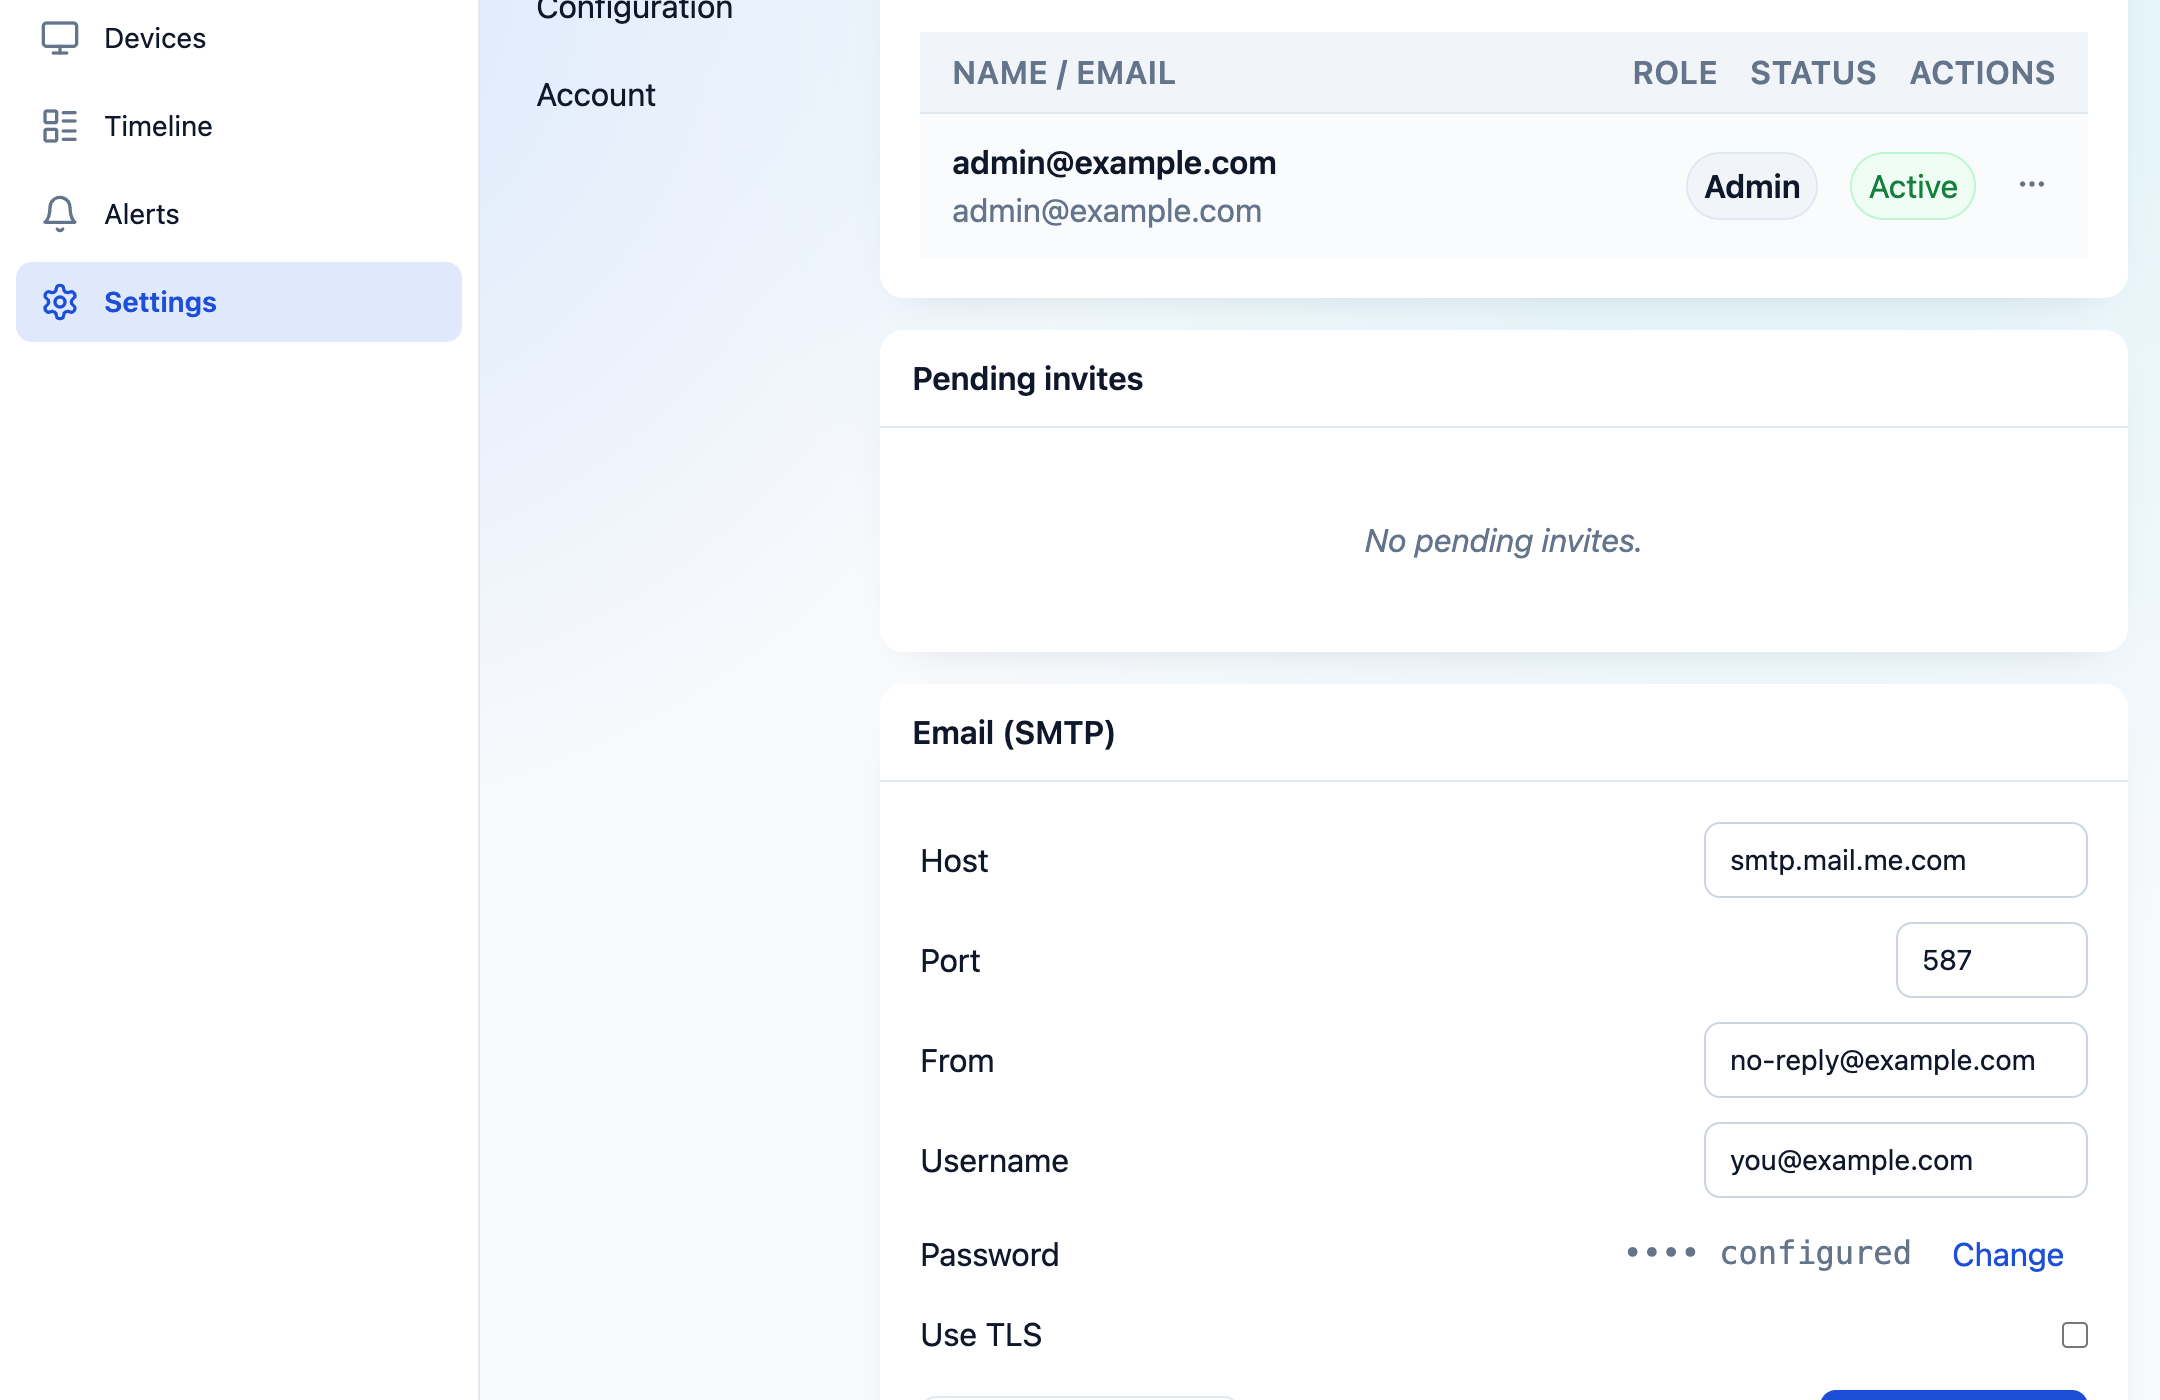
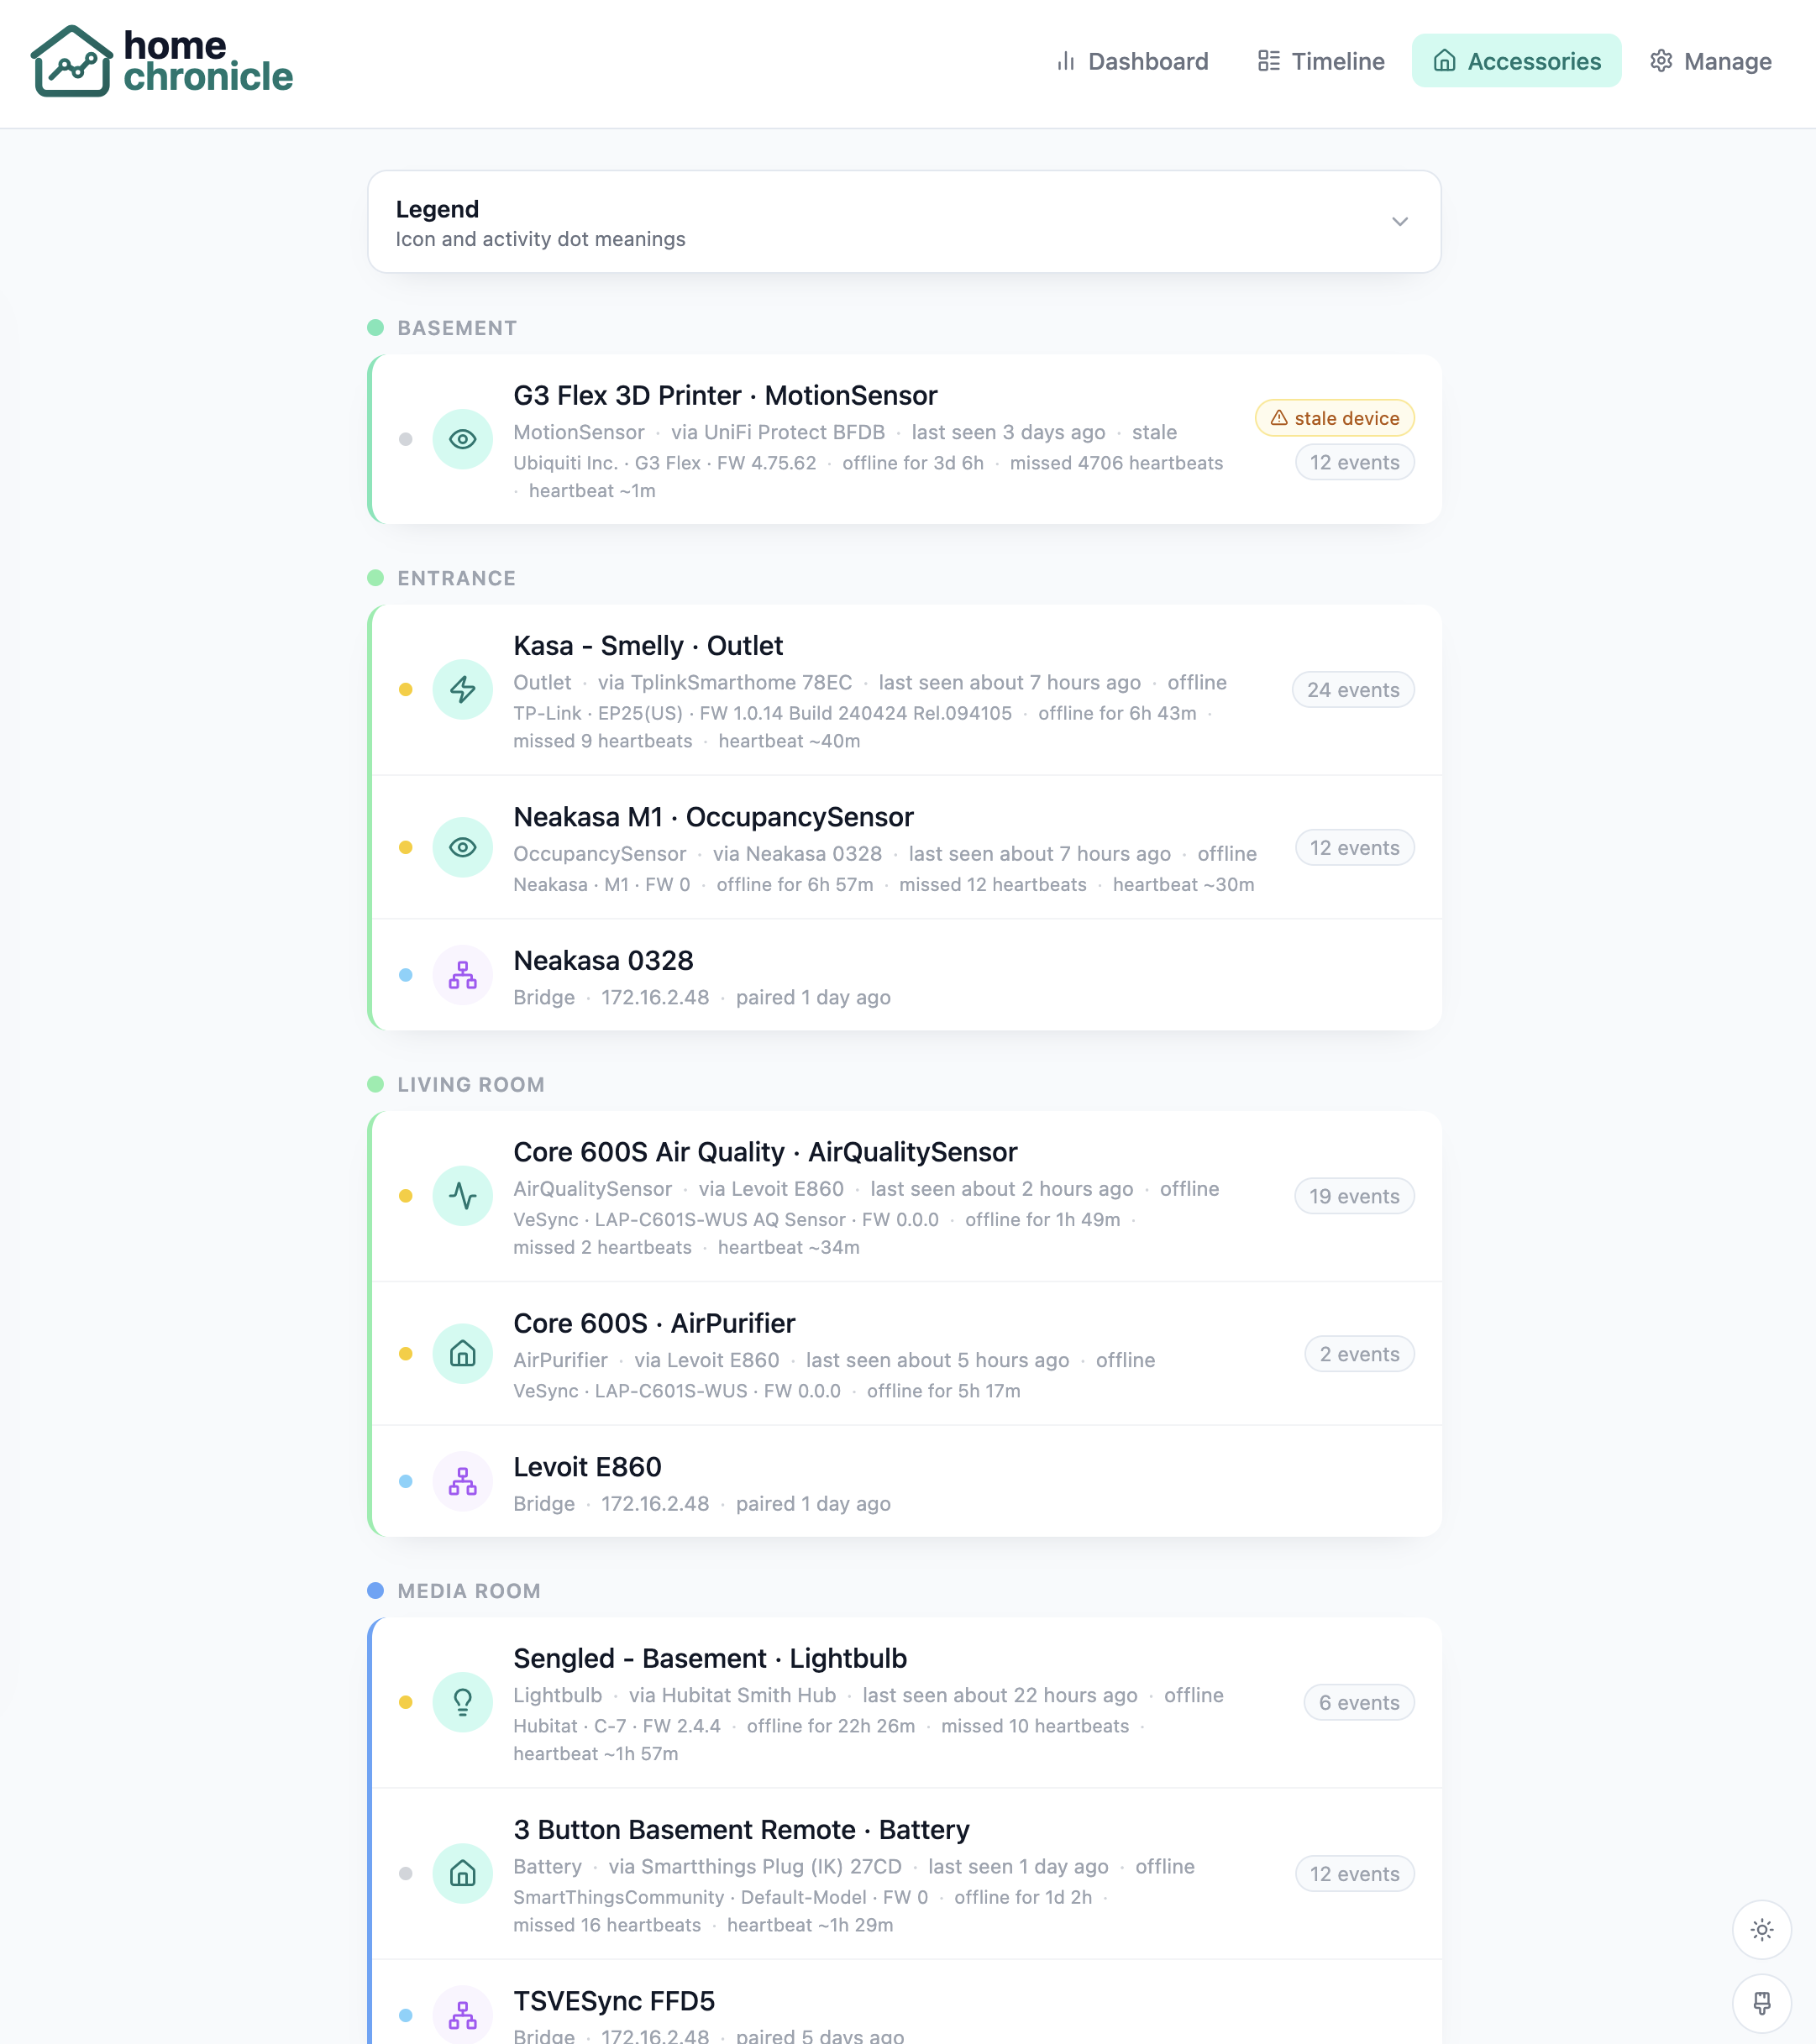
Event Logging for Apple HomeKit

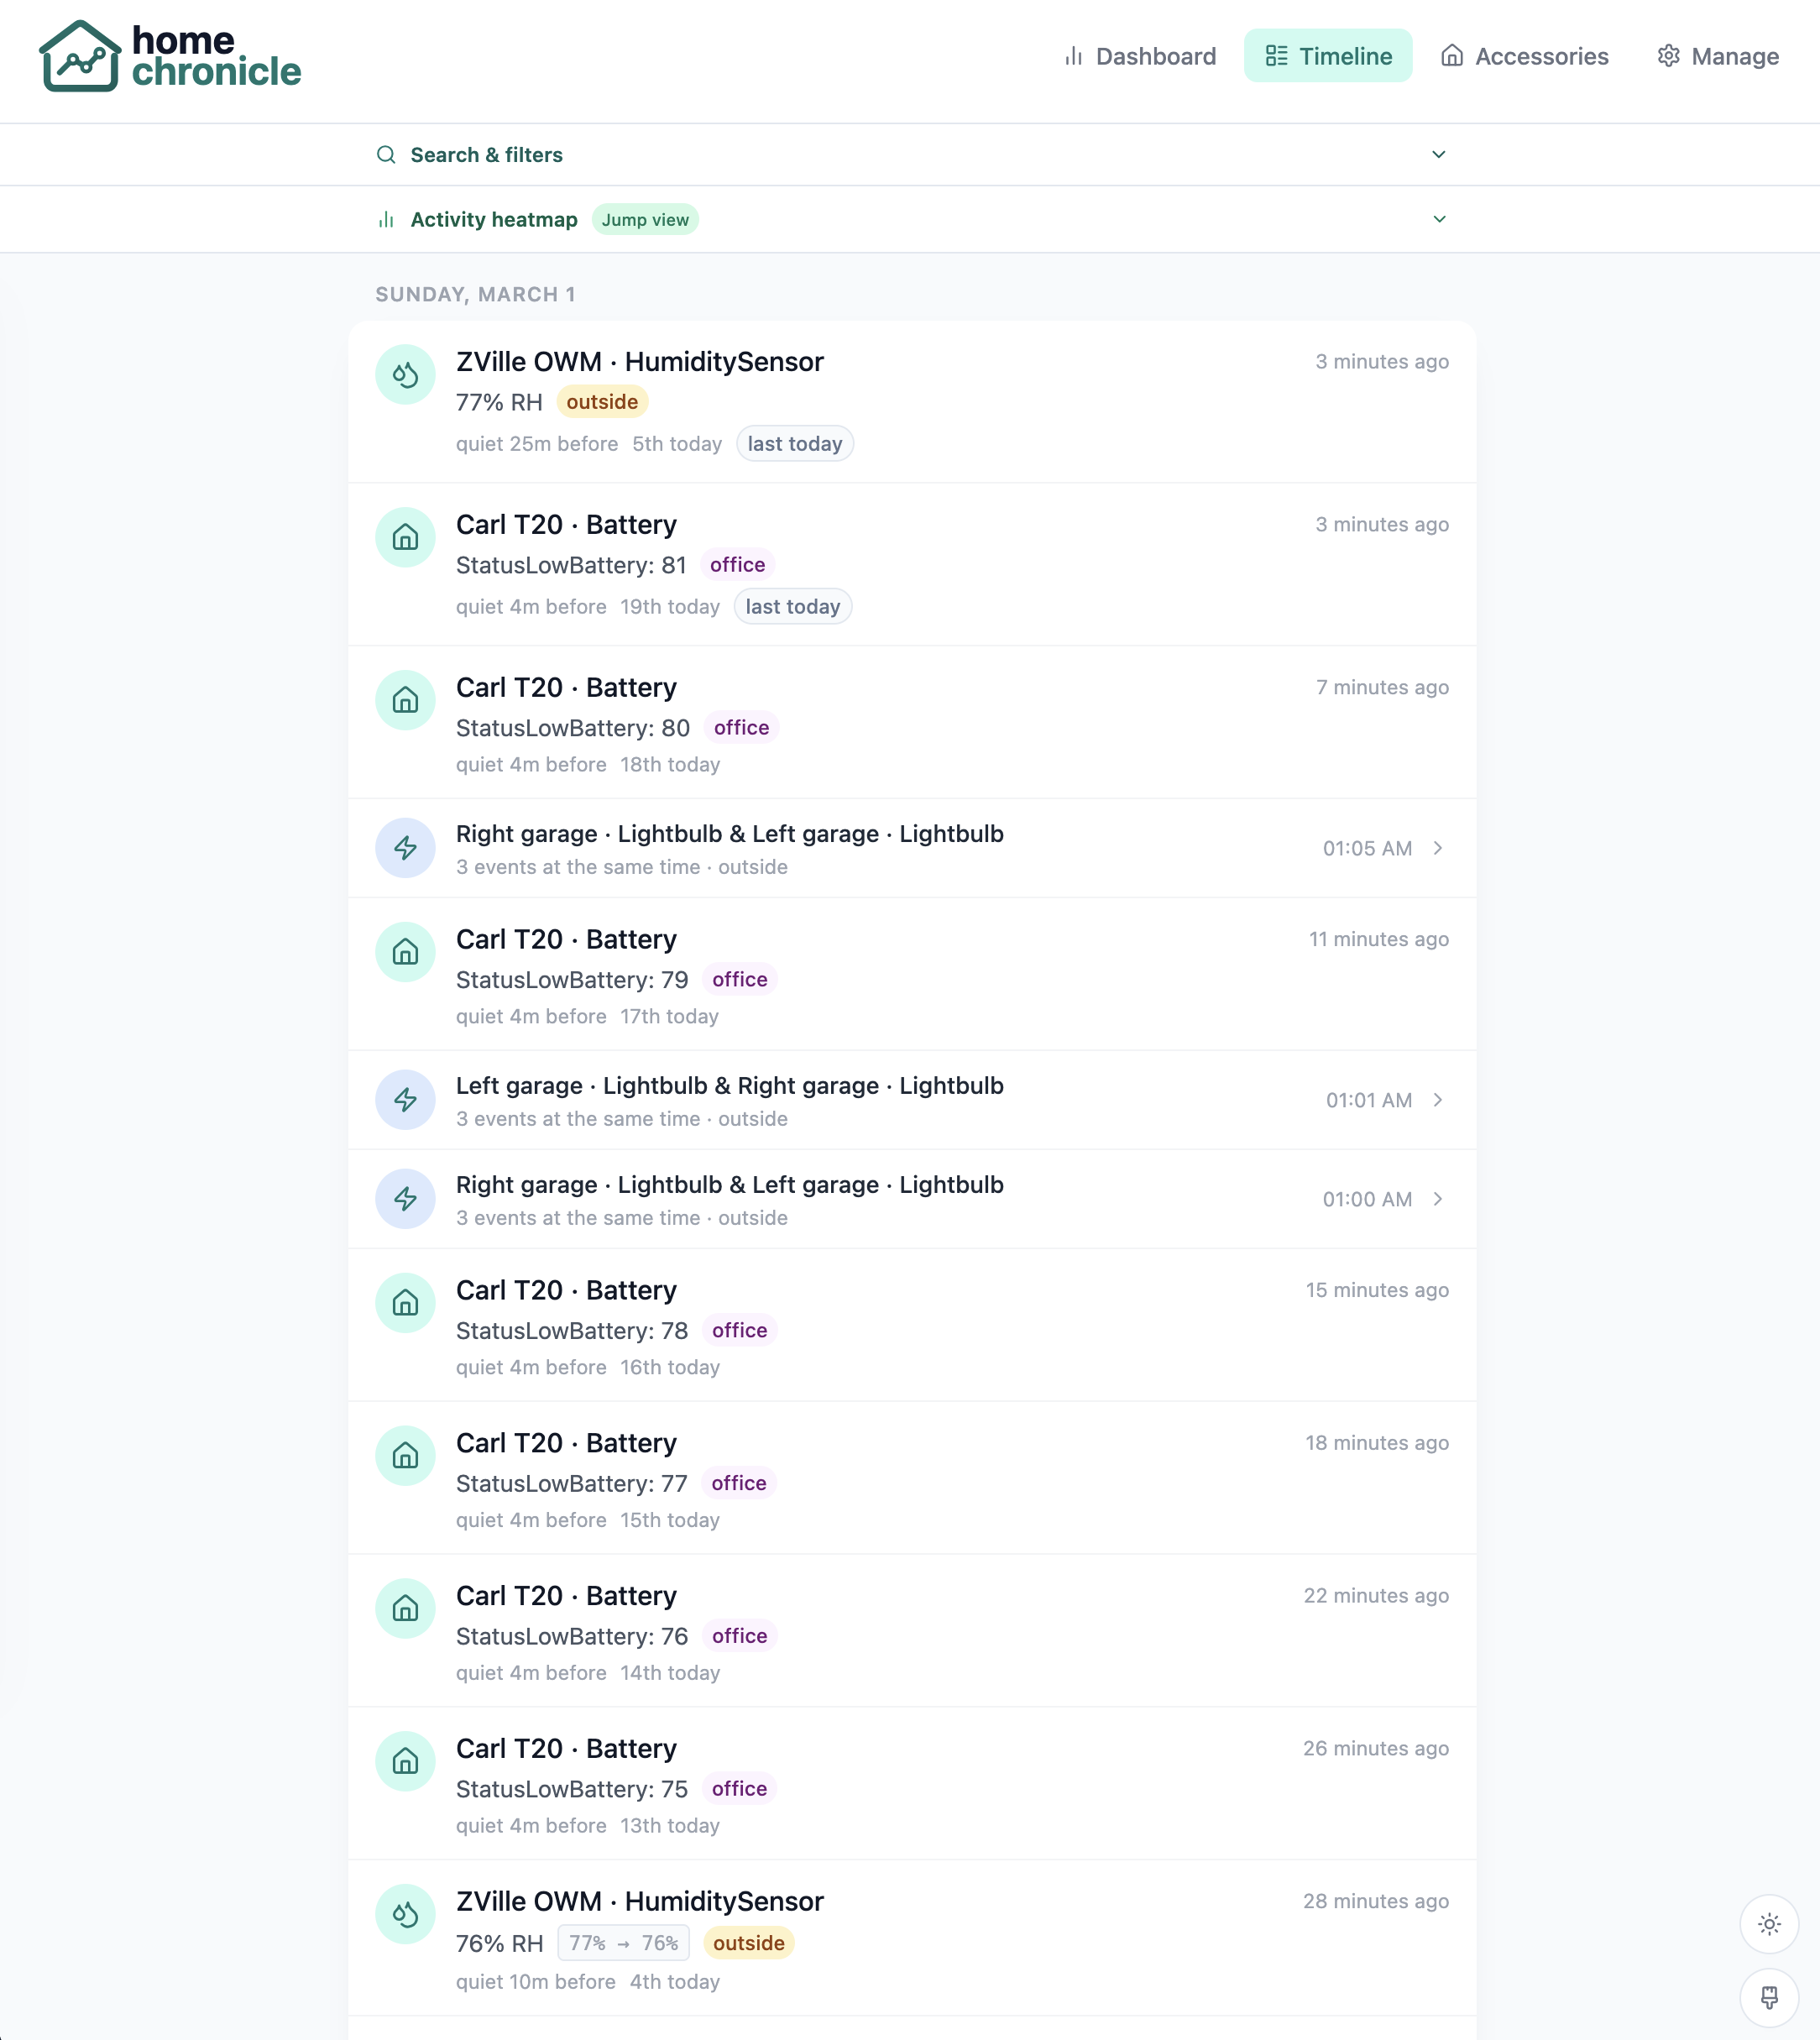
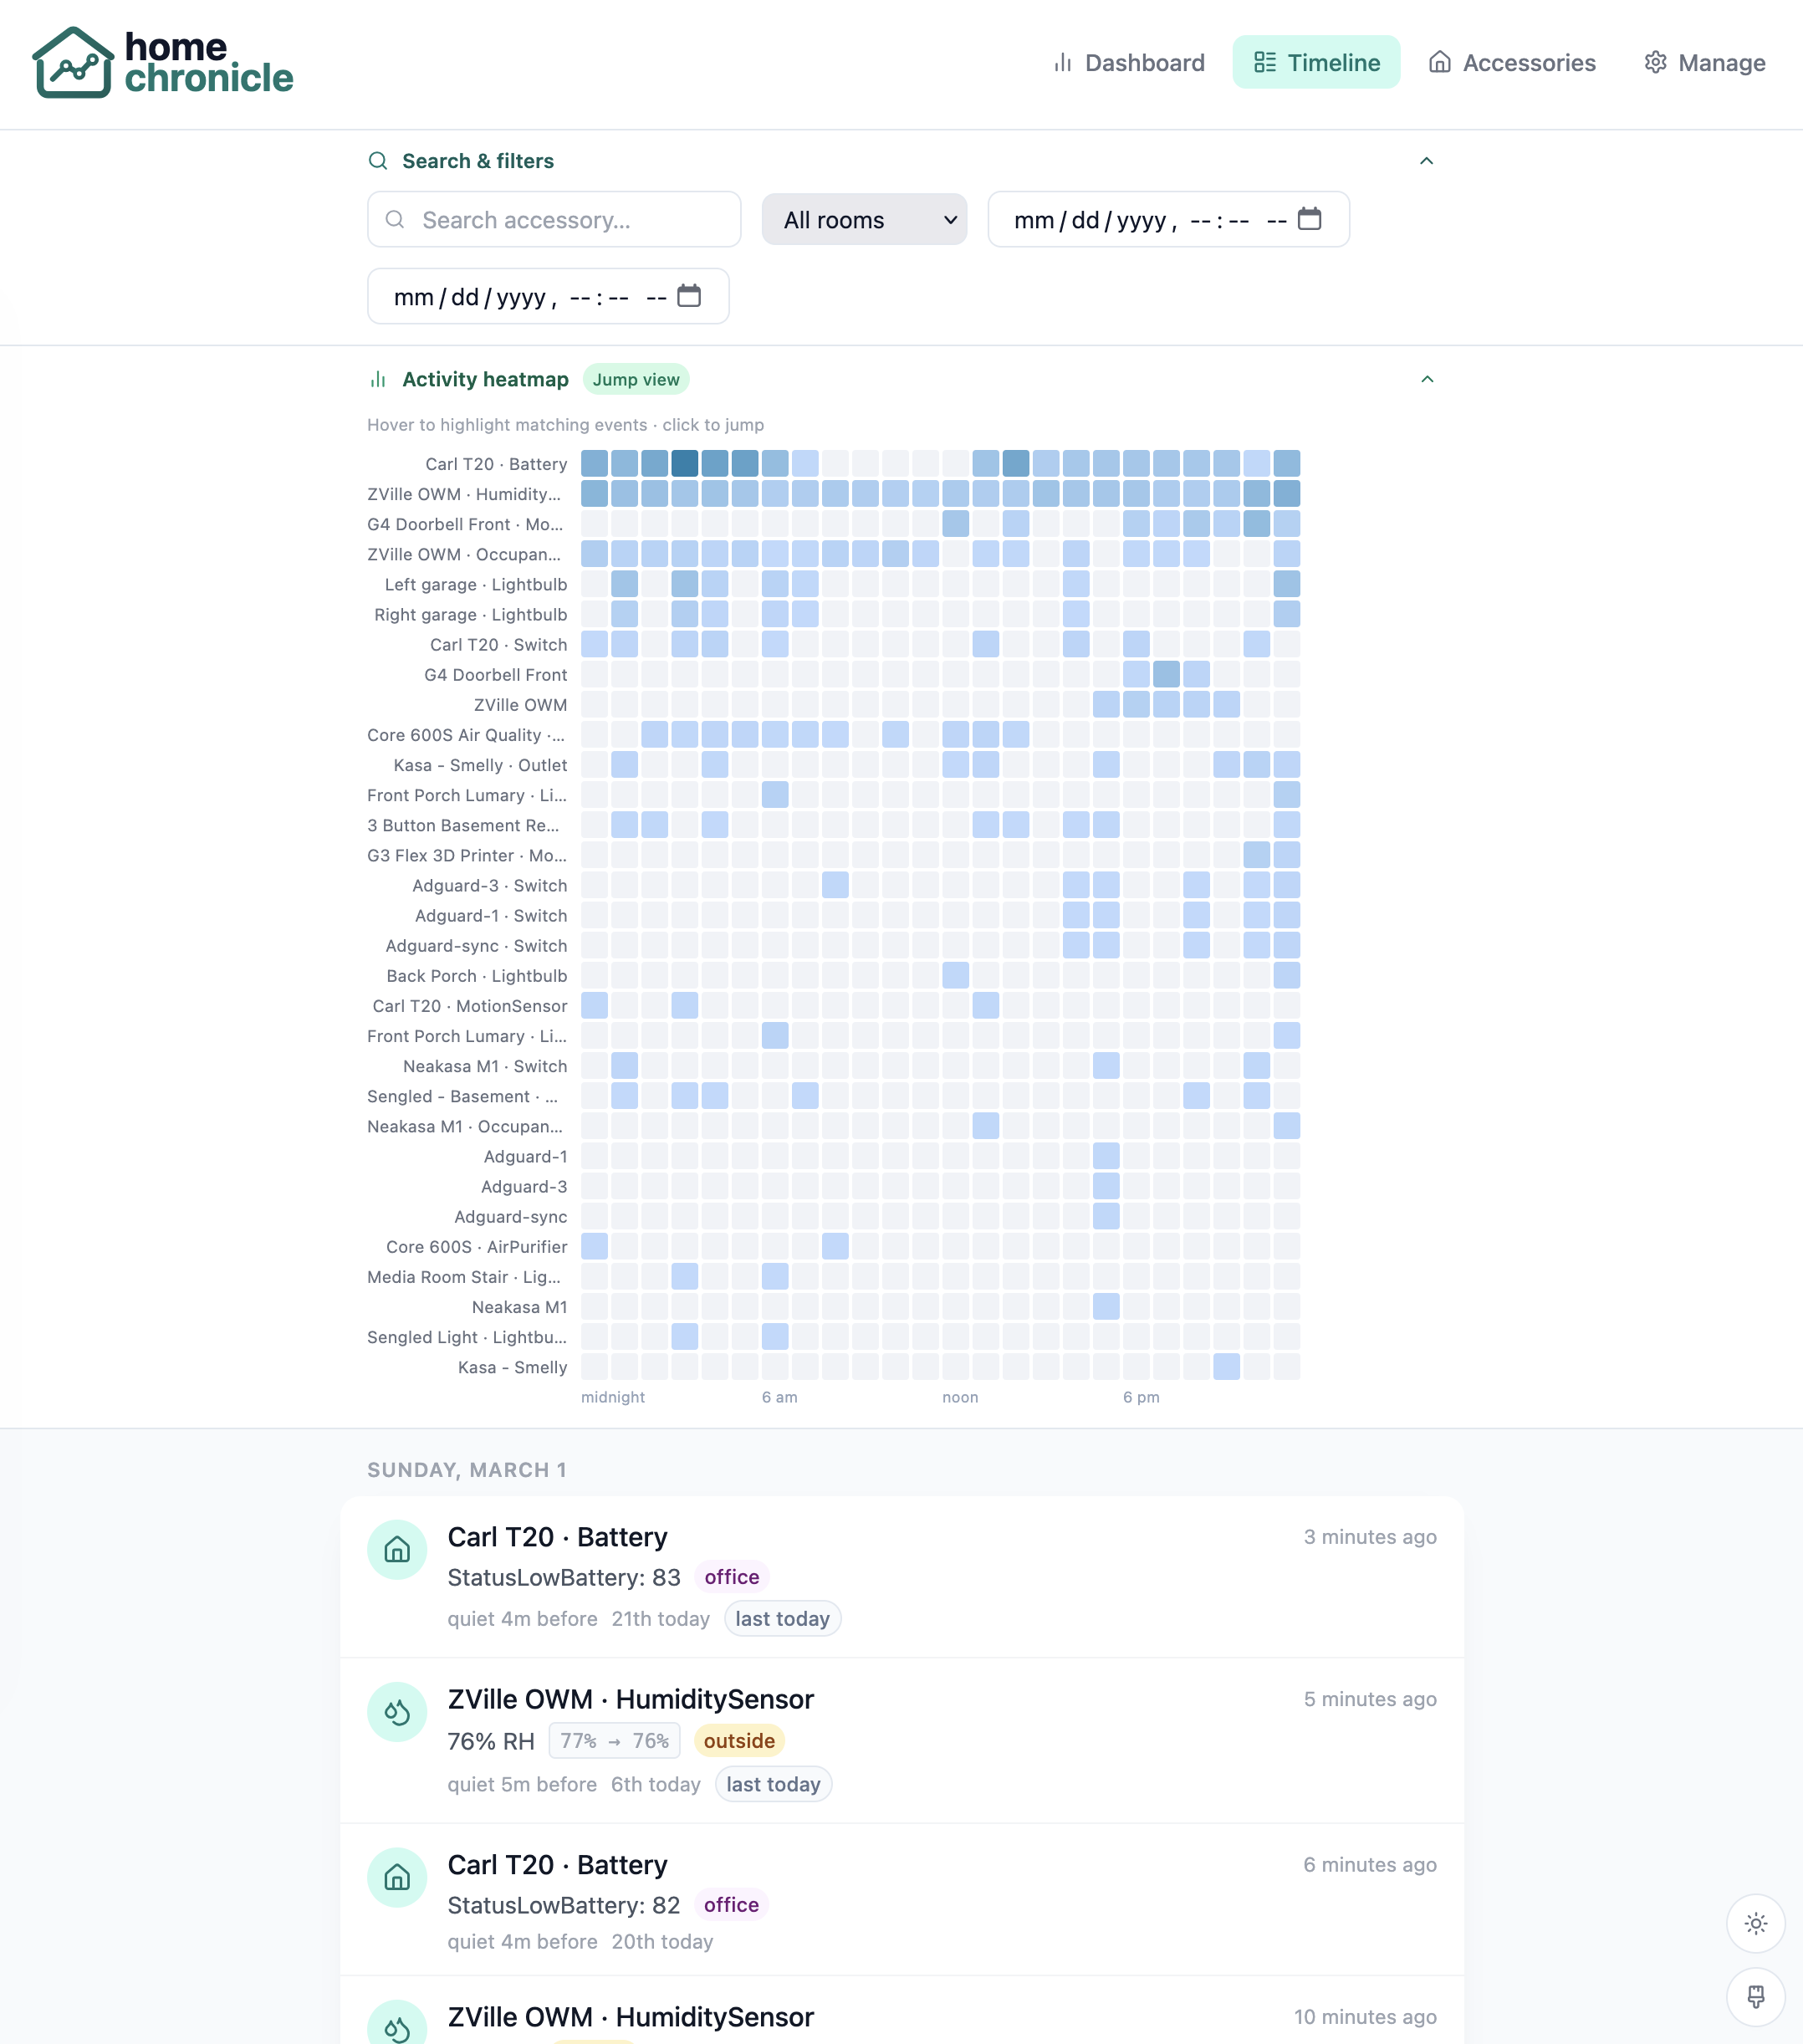
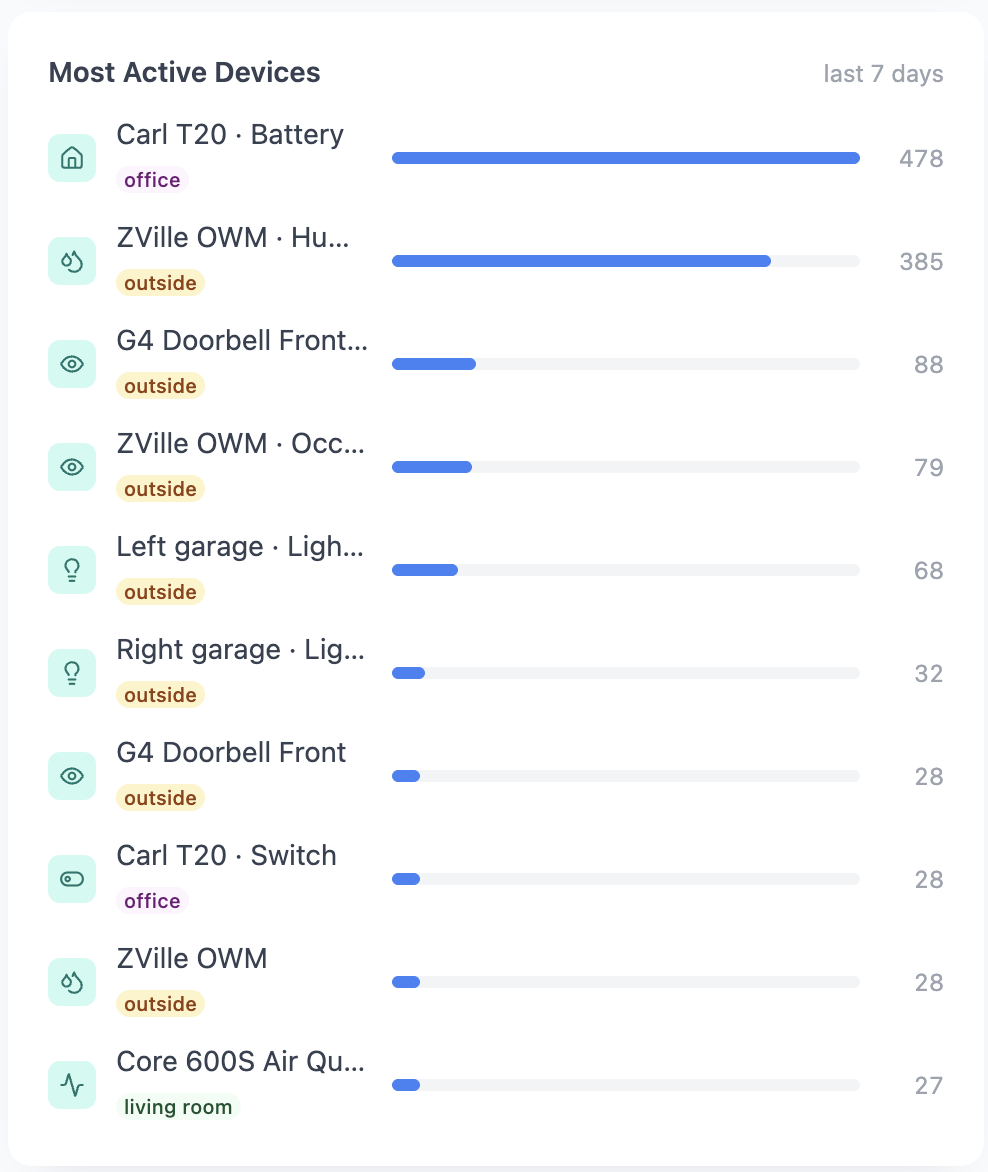
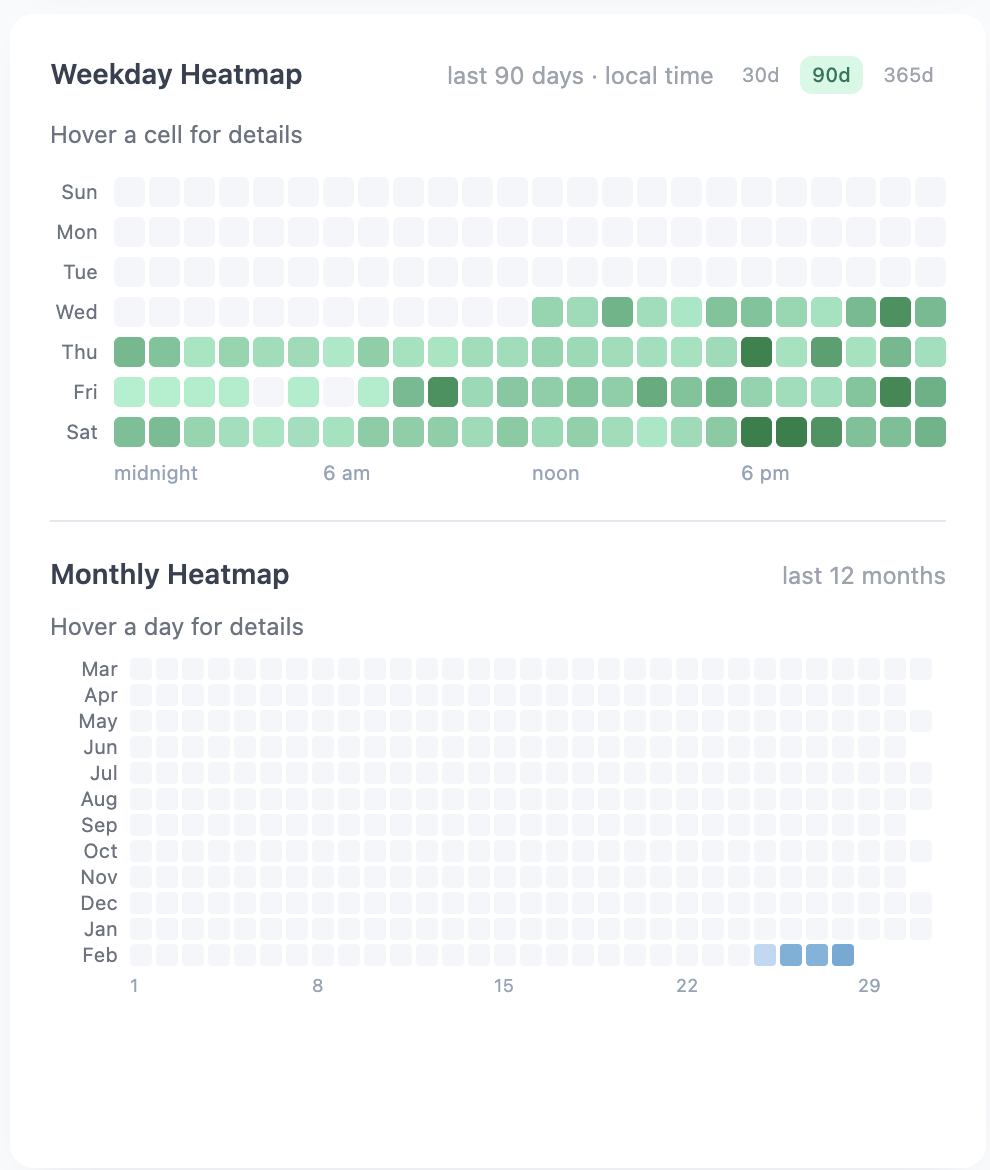
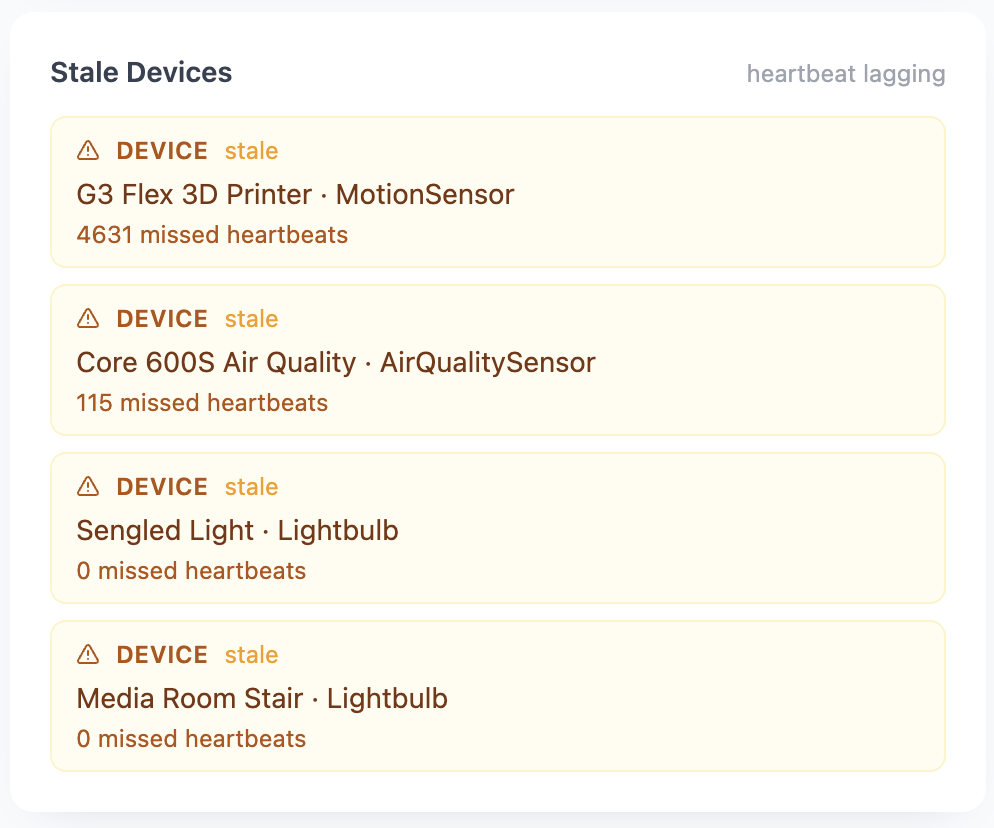
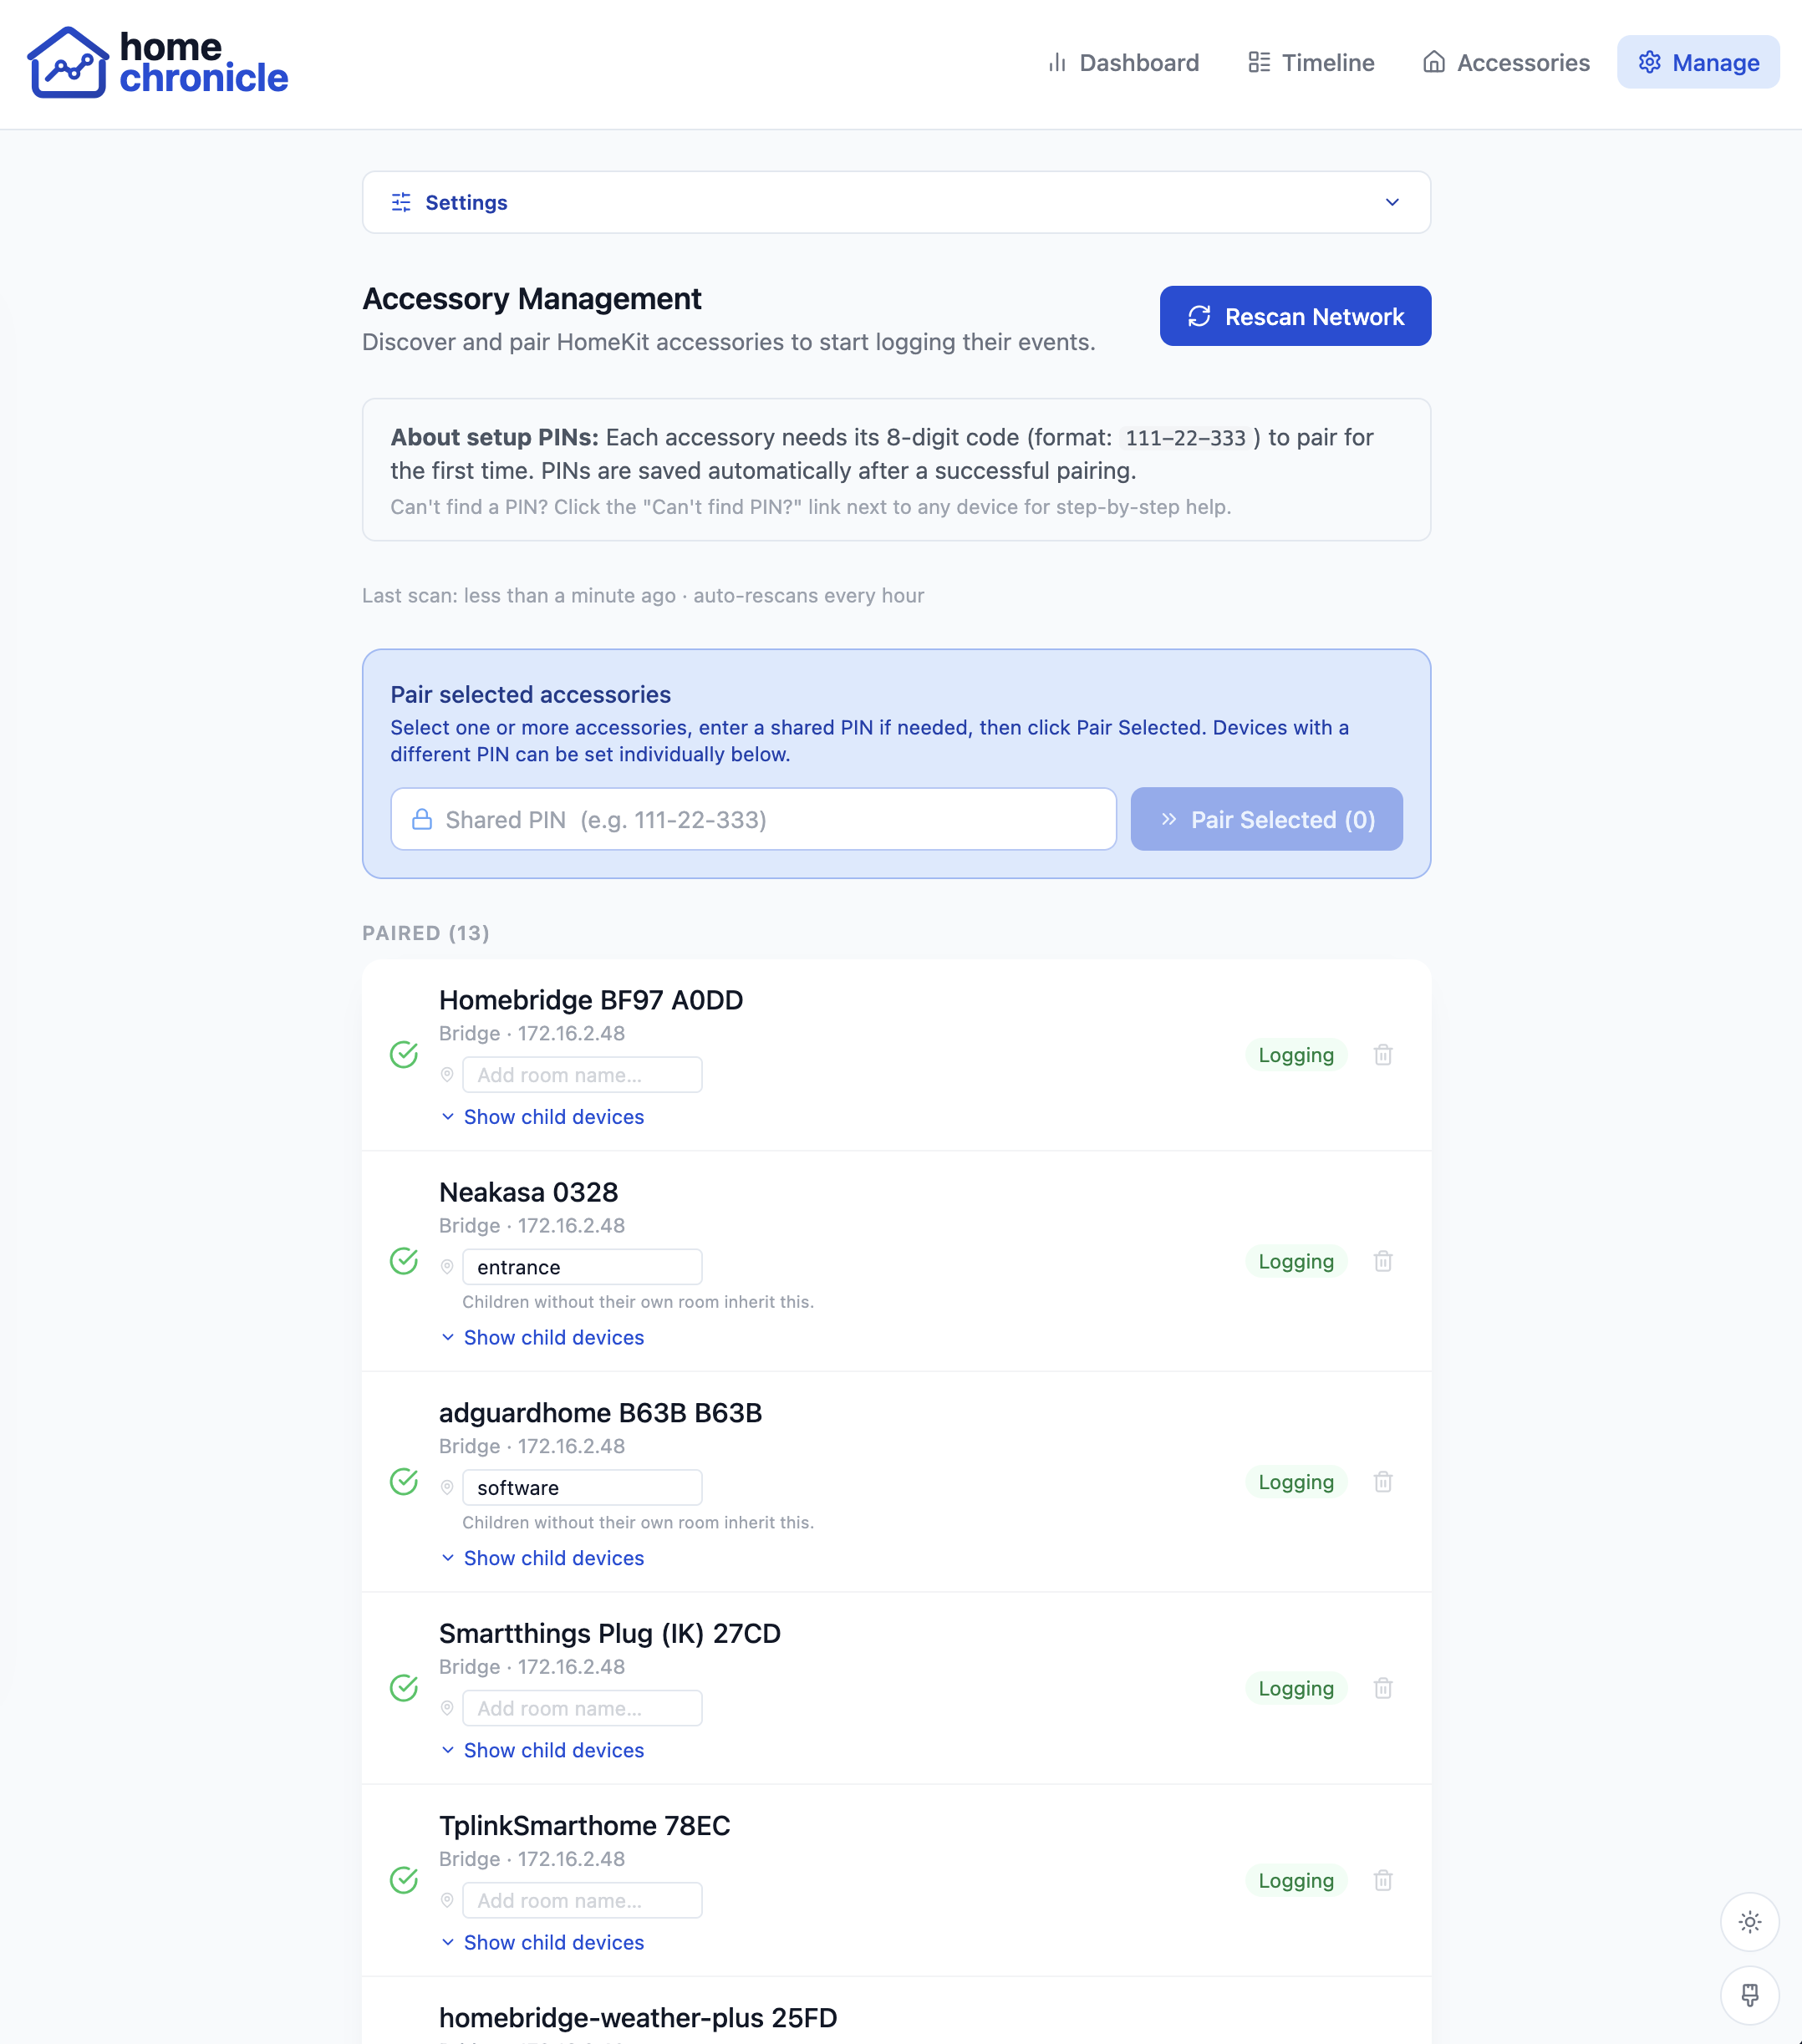
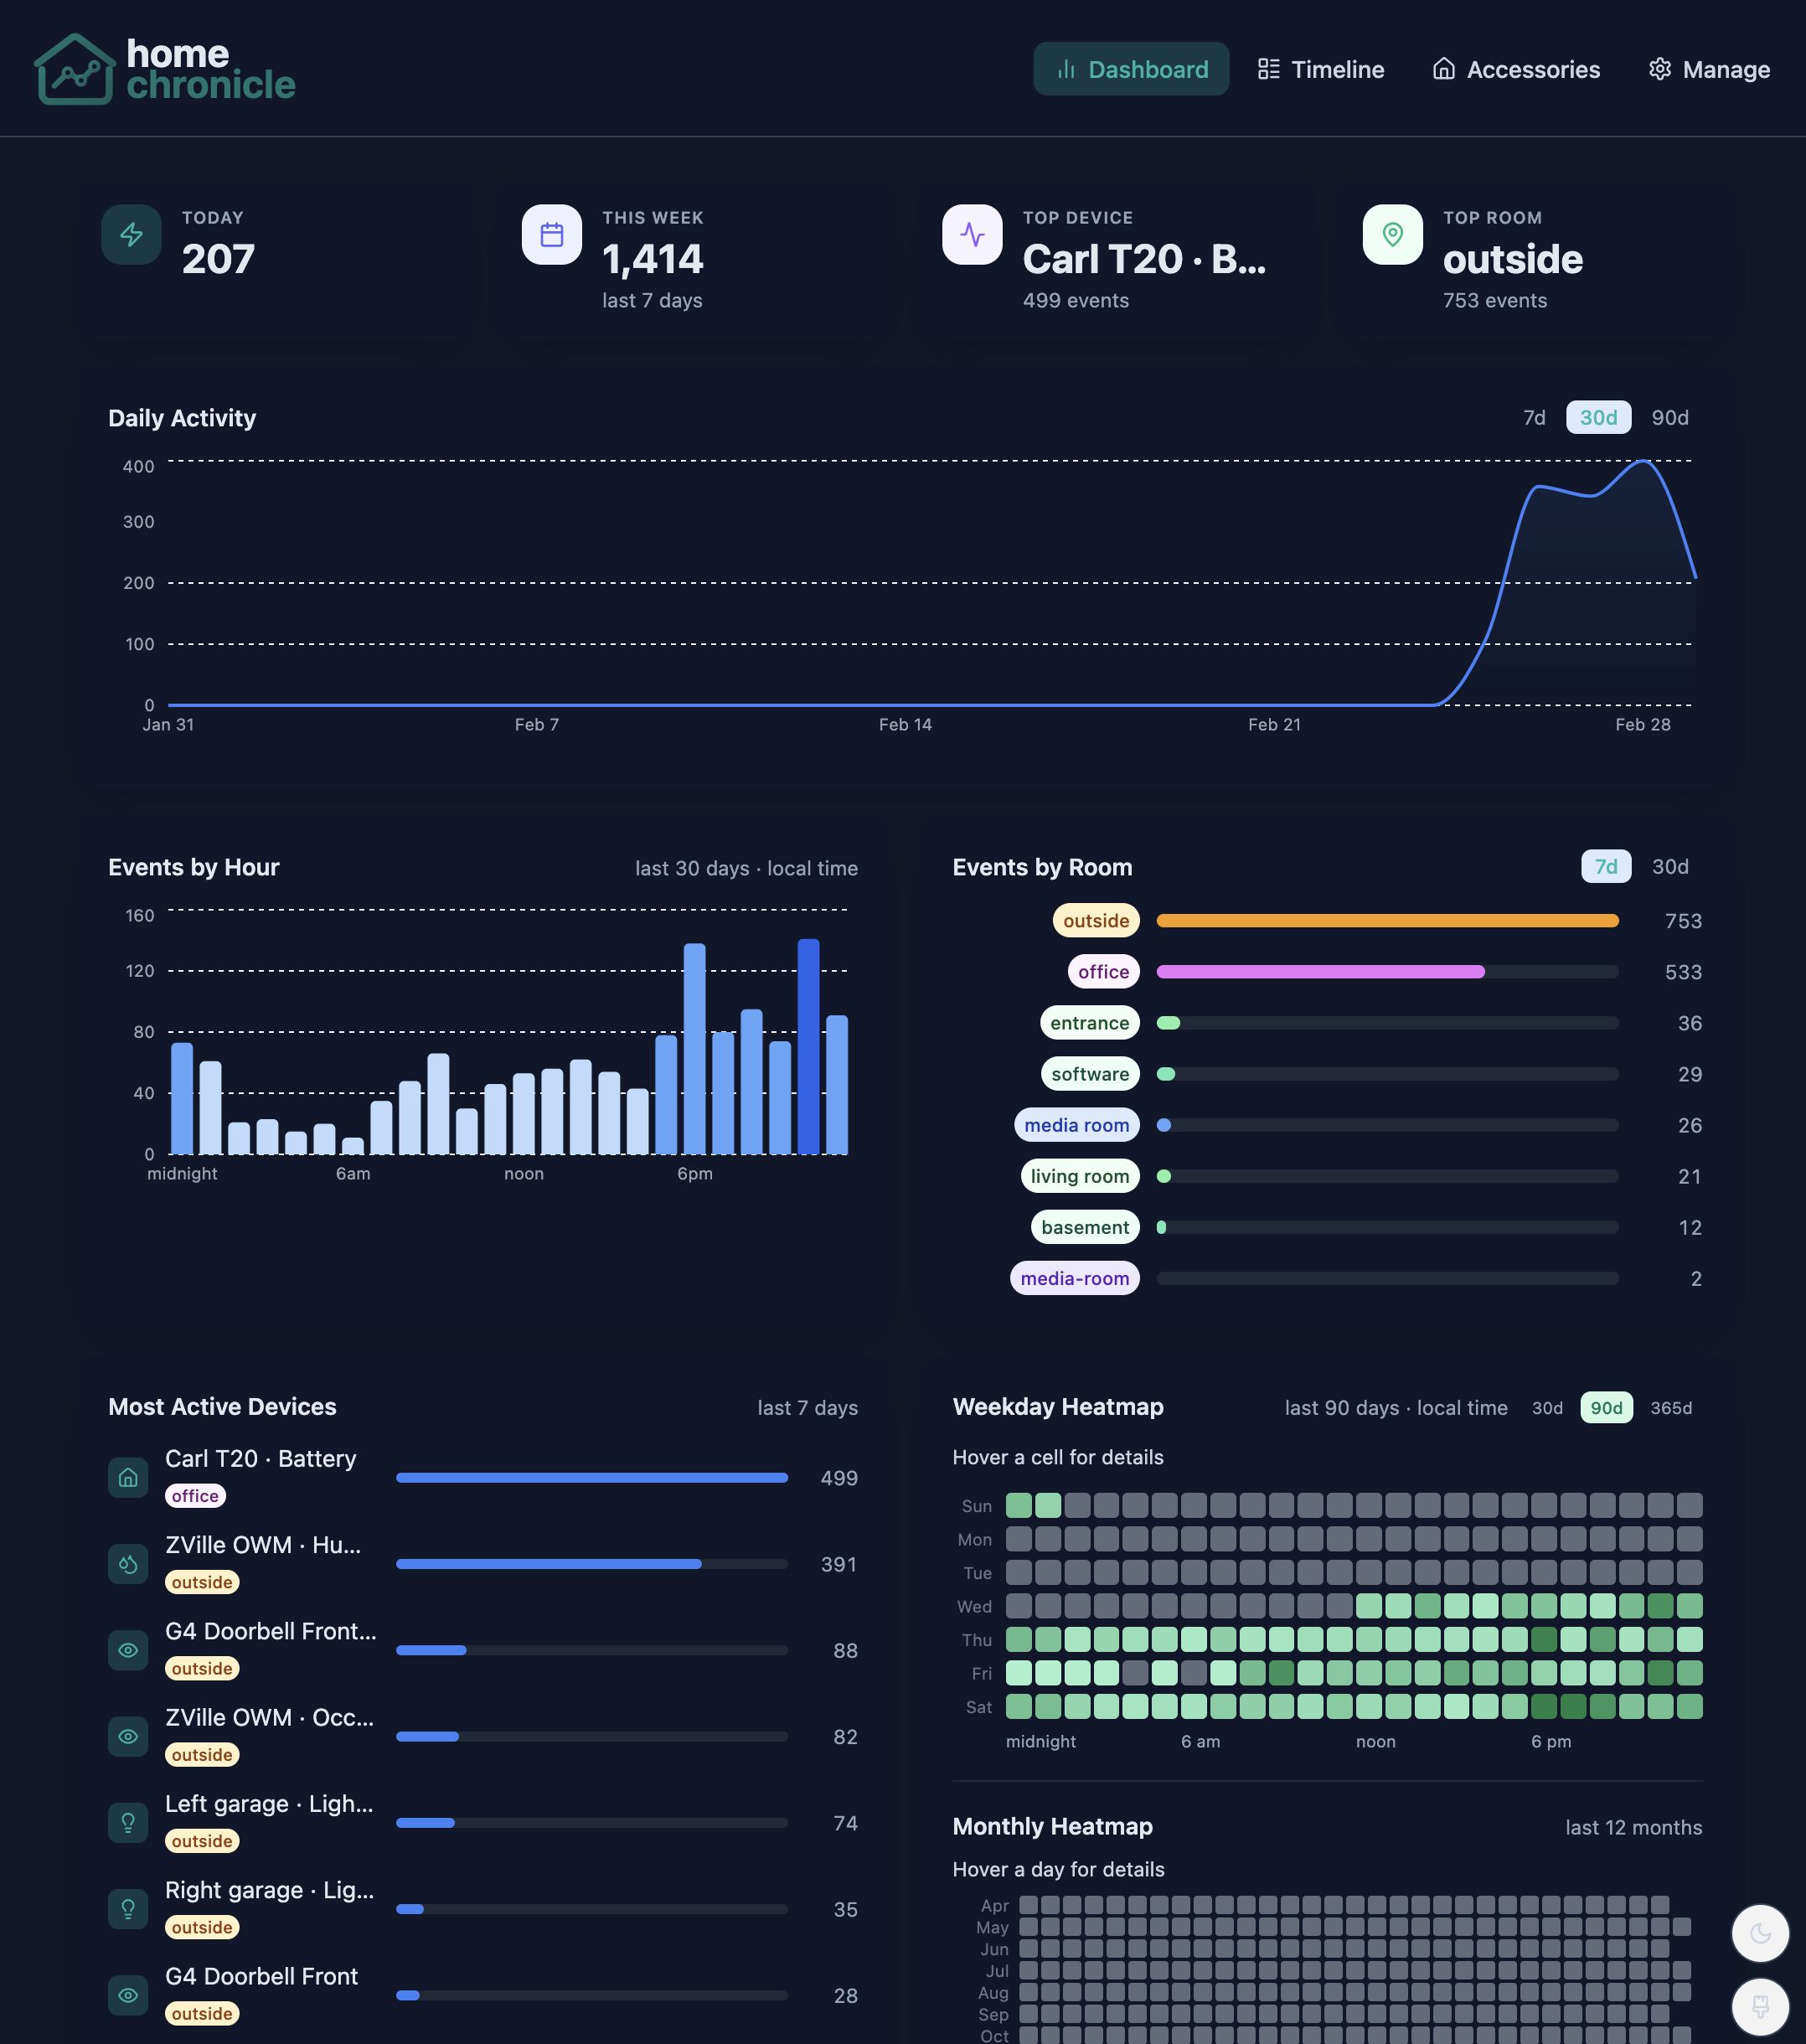
Apple's Home app shows the current state of your accessories — homechronicle shows you everything that happened and when. A self-hosted dashboard with a searchable timeline, activity analytics, and device management.

homechronicle Dashboard — activity analytics, trend charts, heatmaps, and device rankings
Everything you need to monitor your smart home
homechronicle captures every state change from your HomeKit accessories and turns raw events into actionable insights.
📋

Real-time Event Timeline

Scrollable, day-grouped event feed with auto-refresh. Filter by room, accessory, characteristic, or date range.

📊

Activity Analytics

Daily trends, hourly distribution charts, room breakdowns, weekday and monthly heatmaps at a glance.

📱

Device Inventory

Complete list of paired accessories with room grouping, activity status indicators, bridge info, and event counts.

In-Browser Setup

Discover, pair, and configure accessories directly from the UI. Bulk pairing, PIN vault, and bridge child expansion.

🎨

Themes & Dark Mode

Light and dark modes with six color themes. Customize the look to match your preference.

🌐

Installable PWA

Add to your home screen on iOS or Android. Works like a native app with responsive mobile-first design.

🧪

Matter Support (Beta)

Pair and monitor Matter devices directly from the Setup UI. Built into the listener image with zero extra configuration.

🐳

Docker Ready

Single docker run deploys everything. Or use Docker Compose for fine-grained control. No build steps required.

Every event, searchable and filterable

A live, scrollable timeline grouped by day shows every state change across your home. Scene grouping bundles events that fire within seconds of each other.

  • Filter by room, accessory name, characteristic, or date range
  • Activity heatmap with click-to-jump navigation
  • Human-readable service type labels instead of raw HAP UUIDs
  • Auto-refreshes every 10 seconds
Timeline — live event feed grouped by day

Visual heatmap for fast navigation

The activity heatmap shows event density by device and time of day. Click any cell to jump directly to that moment in the timeline. Combined with powerful search filters, finding any event is instant.

  • Per-device hourly heatmap with color-coded density
  • Deterministic page targeting for stable navigation
  • Combine with room and accessory filters to narrow results
Timeline — search filters with activity heatmap for jump navigation
Activity analytics at a glance
KPI cards, trend lines, hourly distributions, room breakdowns, device rankings, and heatmaps — everything you need to understand your smart home's behavior.
KPI cards and daily activity trend

KPI Cards & Daily Trend

Today's count, weekly total, top device, and busiest room. Trend line with 7/30/90-day ranges.

Most active devices ranking

Most Active Devices

Ranked list of your busiest accessories over the last 7 days with room labels and event counts.

Weekday and monthly activity heatmaps

Weekday & Monthly Heatmaps

Spot patterns in your home's activity. See which hours and days are busiest over 30, 90, or 365 days.

Stale device alerts

Stale Device Alerts

Devices that have gone silent are flagged with missed heartbeat counts so you can investigate.

Know every device in your home

A live inventory of all paired accessories, organized by room. At a glance, see which devices are active, which are stale, and how many events each has generated.

  • Activity dots: green (active < 1h), yellow (< 24h), grey (older)
  • Bridge IP addresses and pairing timestamps
  • Child device attribution showing which bridge each device belongs to
  • Total event counts per accessory
Accessories — device inventory grouped by room

Pair devices right from your browser

No command line needed. Discover accessories on your network, enter PINs, and pair directly from the web UI. Homebridge support lets you pair a bridge once and log all child accessories automatically.

  • Network scanning discovers accessories via mDNS
  • Bulk pairing with shared PIN and progress bar
  • PIN vault saves codes after first use
  • Room assignment for accessories and bridge children
  • Configurable retention and stale device thresholds
Manage — accessory pairing wizard Manage — retention and threshold settings

Dark mode & color themes

Switch between light and dark modes, or let the app follow your system preference. Choose from six color themes to personalize the interface.

Dashboard in dark mode
Modern, self-hosted stack
Runs entirely on your local network in Docker. No cloud, no subscriptions, no data leaving your home.
🐳 Docker Compose
⚛️ React 18
⚡ Vite
🐘 PostgreSQL 16
📡 Express
🏠 hap-controller
🔧 Matter
📊 Recharts
🎨 Tailwind CSS
Up and running in minutes
One command to deploy. Pair your first device from the built-in setup wizard.
All-in-one — PostgreSQL, listener, and web UI in a single container
docker run -d \
  --name homechronicle \
  --network host \
  -e WEB_PORT=3000 \
  -v hc-db:/var/lib/postgresql/data \
  -v hc-data:/app/listener/data \
  -v /run/dbus/system_bus_socket:/run/dbus/system_bus_socket:ro \
  havuq/homechronicle-standalone

# Open the dashboard
open http://localhost:3000

# No host networking? Use bridge mode instead:
# docker run -d --name homechronicle -p 3000:80 \
# -v hc-db:/var/lib/postgresql/data \
# -v hc-data:/app/listener/data \
# havuq/homechronicle-standalone
1

Deploy

One docker run on any machine — NAS, Raspberry Pi, or desktop.

2

Pair

Open the Manage tab, scan your network, and pair accessories with their PINs.

3

Monitor

Events stream in automatically. Explore the timeline, dashboard, and analytics.